Callstack
In this topic:
•Setting the context of a specific call stack frame
•Viewing the variables in a specific context
Introduction
The Callstack Window displays a list of functions from top to bottom called at run time from the beginning of a program until the execution of the current statement. It is mainly intended to keep track of the point to which each active subroutine should return control when it finishes executing. Call stack acts as a tool to debug an application when the function to be traced can be called in more than one context.
The Callstack Window is opened via View / Debug / Callstack.
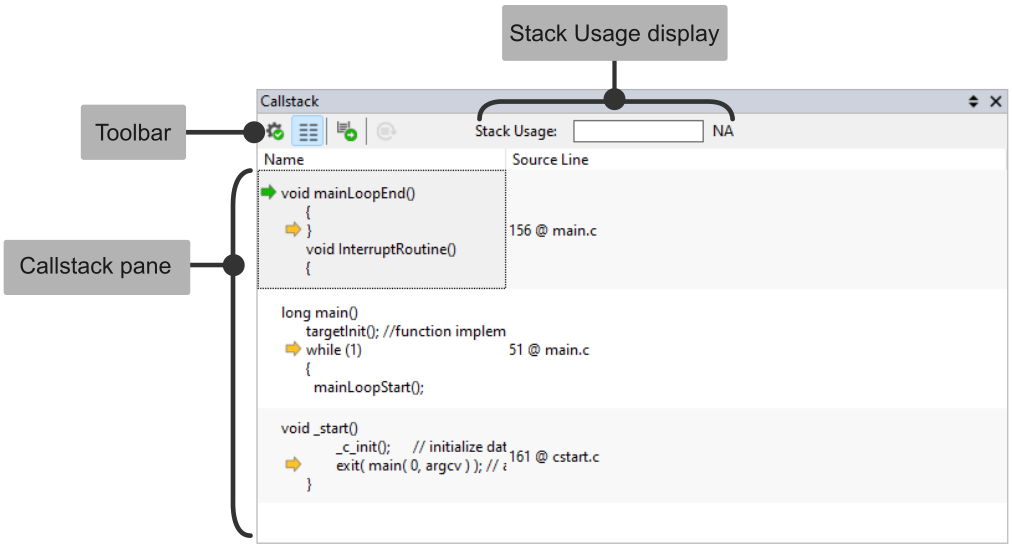
Toolbar
Icon |
Description |
|
|---|---|---|
|
Set Window Options |
Opens Options dialog which allows you to configure how and if the source lines should be displayed; colors and fonts. |
|
View Source line information |
Toggles the display of source lines. |
|
Set Context |
Sets context of the chosen call stack item. |
|
Reseed Stack |
Seeds the stack with the specified pattern. The pattern is used to measure the amount of stack that has been used. |


The Reseed Stack function fills the stack with a defined pattern. Before executing your application code, the RAM associated with the stack will be filled with this pattern. As the memory assigned to the stack is used, this pattern will be overwritten with new values. By analyzing the stack, winIDEA can determine how much stack the application code has used during code execution.
The usage bar displays:

•Maximum usage - Shaded area
•Current stack pointer position - Vertical line in the bar
•Numerical - Current Usage / Maximum usage / Total size
|
Stack usage measurement needs to be enabled in the Stack Usage options and is displayed only when the CPU is stopped. |

Callstack pane
The Callstack pane shows the current call stack content. Function names are shown on the left, while the source line numbers at which the next function call occurred are listed on the right. Double clicking on an item will automatically set the context for that specific item. Other windows e.g. Editor, Disassembly, Locals synchronize the content, e.g. Locals display local variables of selected function context.
The Callstack pane is divided into:
Name column - Holds the name and the return type of the function from which the next function on the call stack was called. In case macros were used to define this function, the function name will be displayed. Optionally the source lines surrounding the function call are displayed. In case a macro function was called, macro call will be in the displayed source lines.
Source line column - Holds the information about the location (line number and the source file) of the source line.
Callstack frames - Shows the list of function calls that are currently active in the program, with the most recently called function at the top of the list. Each function call is represented by a stack frame, which contains information about the function's arguments, local variables, and return address.
Callstack pointers display:
Icon |
Description |
|---|---|
|
Active stack frame |
|
Execution point of a stack frame |


|
If you are experiencing issues with the Callstack display, check the compiler manual for any relevant compiler switches. Compilers might optimize the code to an extent that the callstack information is no longer available. |
Setting the context of a specific call stack frame
You can double-click a function in the Callstack (or click Set Context button) to navigate to a function's source code or disassembled object code from the Callstack. If source code for the selected function is not available, it displays the function's object code in the Disassembly.
Setting the context to a specific stack frame changes the view of the program shown in the Locals and other debugger windows (i.e. displays local variables and register values for the selected function context), but does not change the next line of execution or the value stored in the program counter.
When a context other than the active is selected, the program execution point is indicated with a triangular indicator:
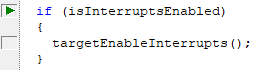 |
Viewing the variables in a specific context
When a context is set to one of the previous call stack frames, Locals changes the context as well, and shows the variables valid in this new context. The values of the variables are reconstructed (if possible).
More resources
•Callstack Window in winIDEA - Video Tutorial
•Troubleshooting tips and tricks in Knowledge Base