Terminal
In this topic:
•List of supported VT100 Commands
•ITM Trace via Terminal Window
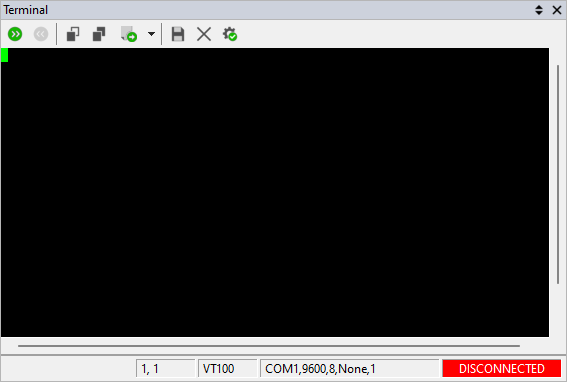
The Terminal Window features VT52, VT100 protocol emulation and can communicate through standard COM ports and additionally through special debugger communication port (e.g. JTAG on ARM family) or shared target memory. This might be very useful especially since many evaluation boards already feature a serial port and the kernel of such boards usually already contains serial communication support, newer boards even include a VT100 terminal. Such boards become quickly operational using the Terminal Window.
The debugging can also become easier as the application can send messages itself to the terminal window.
To open the Terminal window select View / Workspace / Terminal.Configure the Terminal Window before use via right-clicking within the window and selecting Options from the context menu.
 |
Toolbar
Icon |
Name |
Description |
|---|---|---|
|
Connect |
Connect to the terminal |
|
Disconnect |
Disconnect from the terminal |
|
Copy |
Copy the selected text to clipboard |
|
Paste |
Paste the text from clipboard to the terminal |
|
Send ASCII |
Select the ASCII file from the drop down menu. The menu is populated with the files specified in the Terminal Window configuration. The selected file has a bullet next to the name. Click the button to send the selected ASCII file through the terminal |
|
Save To Disk |
Save the contents of the History Buffer to a text file |
|
Clear History Buffer |
Clear the History Buffer |
|
Options |
Opens the Terminal Window configuration dialog |


Status bar
Status bar shows:
•The current cursor position (for example: row 1, column 1);
•Emulation type (for example: VT100);
•Connection port (for example: the COM1 serial port, with 9600 bps, 8 bit, Parity None, 1 stop bit).
List of supported VT100 Commands
Command |
Description |
|---|---|
ESC 7 |
Save Cursor |
ESC 8 |
Restore Cursor |
ESC H |
Horizontal tabulation set |
ESC D |
Index |
ESC E |
Next line |
ESC M |
Reverse Index |
ESC c |
Reset To Initial State |
ESC [A |
Cursor Up |
ESC [B |
Cursor Down |
ESC [C |
Cursor Forward |
ESC [D |
Cursor Backward |
ESC [K |
Erase from cursor to end of line |
ESC [J |
Erase from cursor to end of screen |
ESC [g |
Clear tab at current cursor position |
ESC [0m |
Attributes off |
ESC [1m |
Bold or Increased intensity |
ESC [4m |
Underscore |
ESC [5m |
Blink |
ESC [7m |
Negative (reverse) image |
ESC [nD |
Cursor backward n chars |
ESC [nB |
Cursor down n lines |
ESC [nC |
Cursor forward n chars |
ESC [m;nH |
Cursor position to column m and row n |
ESC [nA |
Cursor up n lines |
ESC [nJ |
Erase in display n = 0 - erase from cursor down n = 1 - erase from cursor up n = 2 - clear screen |
ESC [nK |
Erase In Line n = 0 - erase from cursor to right n = 1 - erase from cursor to left n = 2 - erase from current line to end of screen |
ESC [m;nf |
Set horizontal and vertical cursor position to column m and row n |
ESC [ng |
Tabulation clear n = 0 - clear tab at cursor n = 3 - clear all tabs |
Options
To configure the window options right-click in the window and select Options from the context menu.
Options dialog allows you to display information for easier navigation:
Serial Port configuration
The following parameters need to be configured when using the serial port:
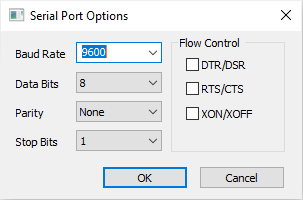 |
Baud Rate - Selects the baud rate the terminal is connected with.
Data Bits - Selects the number of data bits in the communication.
Parity - Selects the type of parity used.
Stop Bits - Selects the number of stop bits in the communication.
Flow Control - Selects the type of flow control used.
ITM Trace via Terminal Window
1. Select View menu / Workspace / Terminal Window. 2. Click Options button from the Terminal Window toolbar. 3. Select Debugger from the drop-down menu and click Configure. 4. Select Trace Channel as Communication Type and click Advanced. 5. Make sure that either: •All is selected in the Enabled drop-down menu or •Selected is selected in the Enabled drop-down menu and one ITM Stimuli is enabled, e.g. ITM (0) 6. Perform Debug Download. 7. Click Connect button in the Terminal Window. 8. Run the program (F5) and observe the application printing the string which is written in the core. |

|
Refer to ARM Cortex-M Instrumentation Trace Tutorial for a detailed use case. |