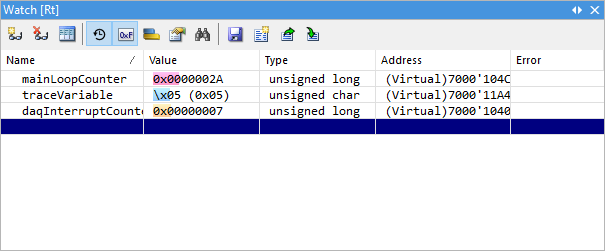
Enabling graphical display
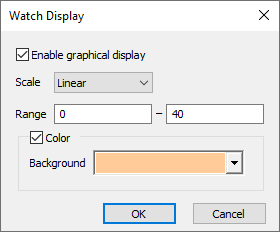
Dialog Watch Display enables adding a bar-graph type visualization in the background to selected variables. Each variable can be displayed in a different color.
 |
|
Open Watch Display dialog. |

•Right-click within Watches Window and select Display Mode or
•Click on the Set Display Mode button in the Watches toolbar.
|
Enable graphical display. |

|
Select a scale type. |

|
Type in a range within which the graphical display will display the variable’s state. |

|
Select a color for the graphical display. |

|