Coverage Statistics Window
In this topic:
Introduction
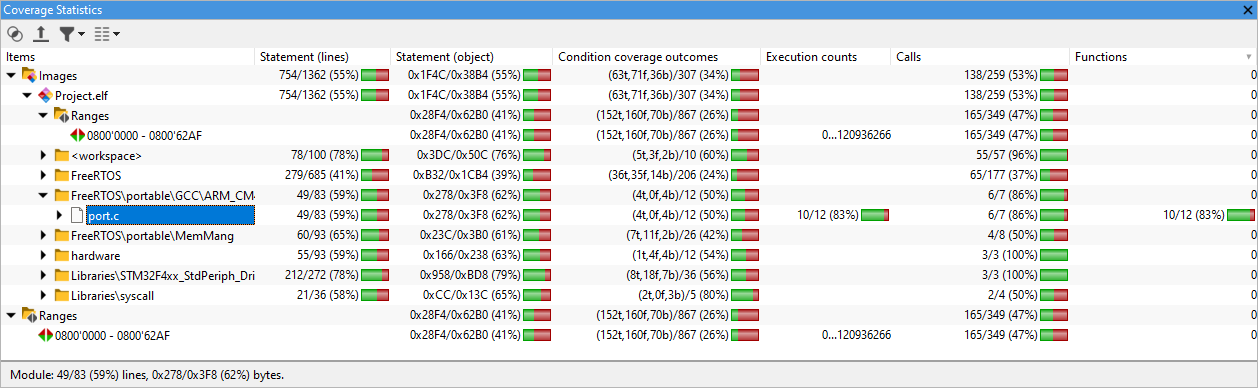
Coverage Statistics window displays the coverage information on the scope of address ranges (which encompass the whole application, including the compiler generated code) as well as for each download file, module, function, source line and object level instruction.
Top level Coverage Statistics window can be displayed in the Analyzer Window by clicking on the Coverage Statistics button  in the Analyzer toolbar.
Toolbar
Icon |
Description |
|
|---|---|---|
|
Accumulate Session Results |
When pressed, the previous results are not cleared when starting a new session. |
|
Export |
Export the coverage data in HTML, Text, CSV, XML and gcov. |
|
Filter items |
Select items to show/hide. Manual selection allows individual item selection. |
|
Show columns |
Select columns to display. |


Column information
Statement coverage (lines)
This column displays statement coverage information on source line level. The first number shows the number of lines executed, the second number shows the number of lines detected in the range.
|
Note that the calculation of the statement coverage on the source level can be changed in the Coverage display setting available via the Analyzer toolbar. It can be configured to either consider the line covered when all corresponding instructions are executed (default), or alternatively, when any corresponding instruction is executed. |

Statement (object)
This column displays statement coverage information on the object code level. The information is shown in MAUs (memory accessible units). This corresponds to number of addresses covered by an item. The first number shows the number of MAUs executed, the second number shows the number of MAUs detected in the range.
Object level condition coverage
The Condition coverage outcome column displays condition coverage information on object code level. The information is shown in number of conditional instructions (such as conditional branches or other conditional instructions). A range with multiple conditional instructions will show:
•number of conditionals with only true outcome (e.g. 6t for CoverageC module)
•number of conditionals with only false outcome (e.g. 6f for CoverageC module)
•number of conditionals with both (true and false) outcomes (e.g. 2b for CoverageC module)
The next number in the column specifies the number of conditional instructions detected in the range (e.g. 19 for CoverageC module).
Percentage indicates the ratio between paths taken (e.g. 6t + 6f + 2×2b = 16 for CoverageC module) and paths possible (e.g. 2×19 = 38 for CoverageC module).
Object level condition coverage will show 100% if all conditional instructions were executed both ways (e.g. 0t, 0f, 19b/19 for CoverageC module).
Execution Counts
The column displays the number of times specific item has been executed.
Item Type |
Information |
|---|---|
Images |
|
Image |
|
Ranges |
Number of executions of an op-code with minimum and an op-code with maximum number of executions |
Folder |
|
Module |
Number of functions executed/detected in the module |
Function |
Number executions of this function |
Line |
Number executions of this line |
Op-code |
Call coverage
This Call column displays the call coverage for the selected range. First number shows the number of executed call op-codes (e.g. call, jarl, bl...) and the second number shows the number of all call op-codes detected in that range.
Function coverage
The Functions column displays the function coverage for the selected range. First number shows the number of functions that were at least partially executed, the second number shows the number of all functions detected.
Configuration options
Refer to Coverage Configuration. Note that the configuration, as well as starting the trace session can can also be performed through winIDEA SDK.
Exporting the trace data
Once the coverage data is obtained, it can be further analyzed in winIDEA or in one of the available coverage export formats: HTML, Text, CSV, XML, gcov. For more information, refer to Coverage Export.
As soon as the Analyzer file (.trd) is loaded, the coverage analysis (if enabled) is shown:
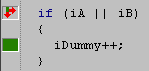
•Next to the source code in the Editor:
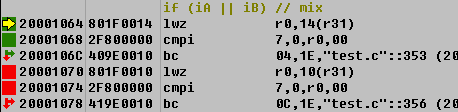
•Next to the instructions in the Disassembly Window: