9.17.118.0.92034 (9.7.2019)
Hotfix build release notes
Software
Analyzer
Profiler
Implemented new Operation mode called Call Site, that can be selected in Analyzer Configuration / Profiler.
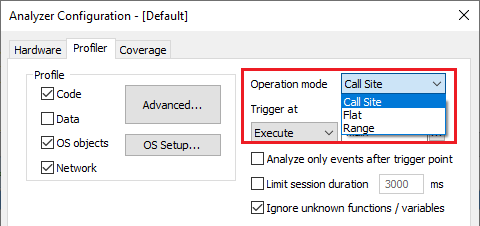
Call Site operation mode determines the function activity by observing its call / exit site and not its entry / exit point as other available operation modes in winIDEA.
Notes:
•If the function doesn't have call sites specified in symbol information, it will be ignored in the analysis.
•If one function calls another, caller function will be shown as suspended in Profiler Timeline ONLY if the called function is configured for profiling.
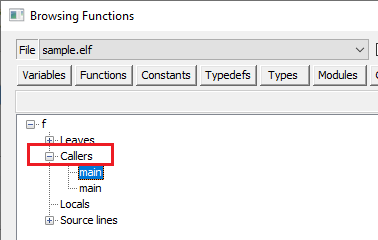
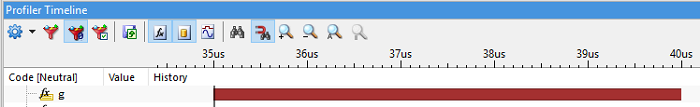
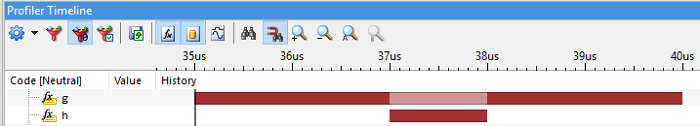
Example where function "g" calls function "h":
Only function "g" is configured for profiling |
Both functions are configured for profiling |
|
|
CPU support
Cortex
Added support for ST STA1385 Telemaco 3P Cortex-A7 ETM trace.