How to record Trace to a Breakpoint
In this topic:
Introduction
Timestamp messages can fill a lot of (or the entire) trace buffer after the CPU reaches a breakpoint, but before the debugger detects that the CPU has stopped.
Configuration steps
Before starting the configuration ensure that core synchronization is active in Hardware | CPU Options | Debugging.
|
Create a new trace configuration. |
|
Check Manual Hardware Trigger and click Configure. |
|
On the Recorder page select the Continuous mode. |
|
On the MCDS page, select your core of interest to be observed by POB-X. |
|
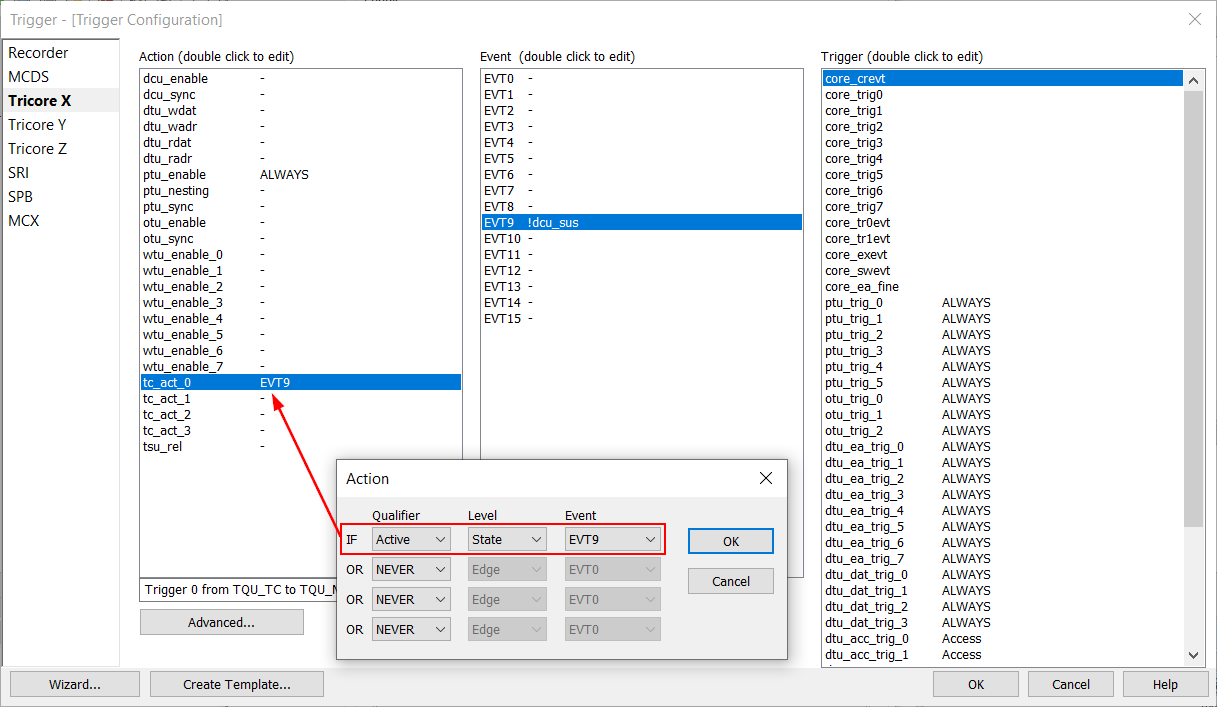
Configure TriCore X page. |
Find an event that references dcu_sus (debug status and control trace unit suspend) and select the inverted (!dcu_sus). In order to achieve that, double-click on EVT9, for example, and enable both dcu_sus and the NOT option.
Map the event to tc_act_0 in the action column.
|
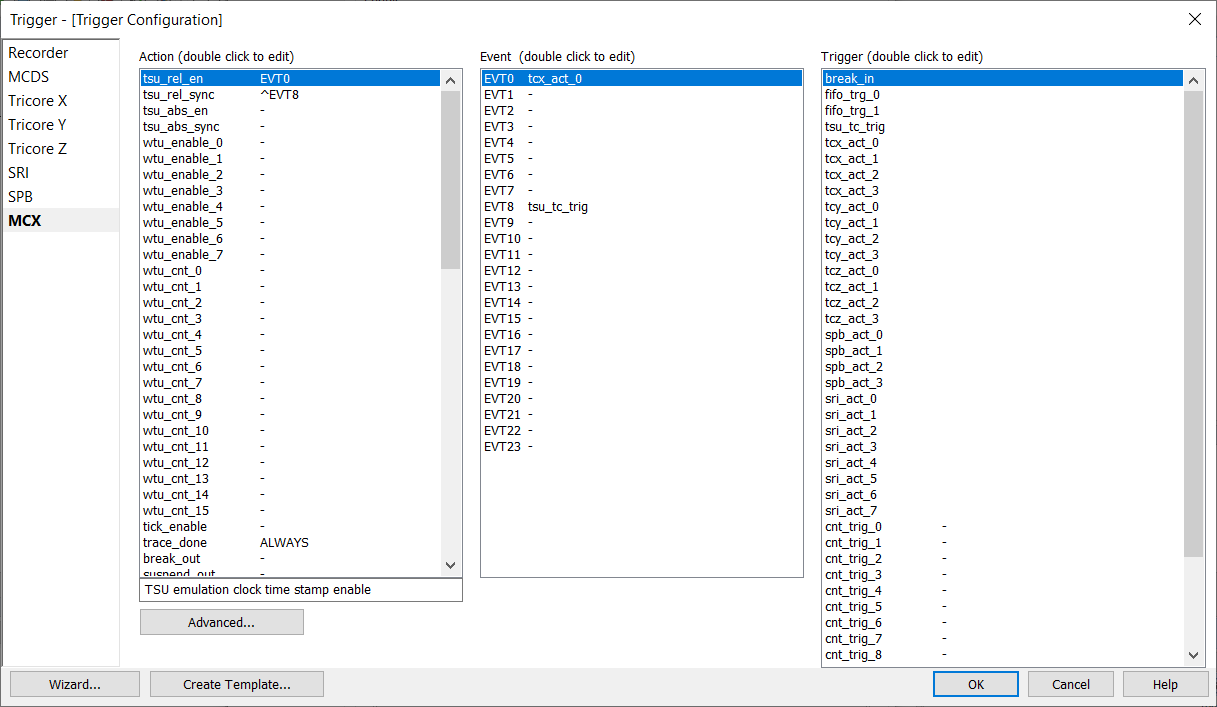
Configure the MCX page as shown below. |
Map tcx_act_0 (which is connected to !dcu_sus) to tsu_rel_en. This means timestamps will only generate while the CPU is not suspended.
|
Start trace and stop the CPU via breakpoint or manually. |
The Analyzer stays in WAITING mode until the stop event and winIDEA reads out the data. The configuration of tsu_rel_en is necessary because otherwise the MCDS would continue to generate trace messages after the CPU is stopped. That would fill the trace buffer with messages without showing any actual data.
More resources
•Infineon Tricore - Trace Multiplexer (MUX)
•Infineon Tricore - Processor Observation Block (POB)


