PMU
In this topic:
Introduction
The PMU (Performance Monitor Unit) is a SoC plugin and provides a possibility to configure the cycle counter and an implementation defined number of event counters.
See below three examples of its usage:
Supported cores
PowerPC PMU plugin supports PMU configuration on the following cores:
•e200z210 •e200z215 •e200z225 •e200z420 •e200z4201n3 •e200z4204n3 |
•e200z425 •e200z7 •e200z720 •e200z7260 •e200z75x |
The plugin can be loaded by selecting View | [SoC.COREn] PowerPC | PMU. Information is displayed when a debug connection is established.
Toolbar
Button |
Description |
|---|---|
|
Enable automatic update which is indicated by a [Rt] in the plugin title |
|
Manual refresh |
|
Reset Counters |
|
Watchpoint configuration (opens Hardware Breakpoints dialog) |
|
|
|
Go to winIDEA Help |


Status row
The Status row displays the current read status.
Columns information
The columns display counter values, events to count and possible ratios between counter values
|
To display or hide columns, right-click on a column header and select what you want to see. |
Configuration
In the Options dialog you can configure Event Counters and Cycle Counter for two generations of PMU.
Generation 1
Enabled - Enable the PMU unit.
Counter check box - Enable and configure selected Counter.
Global Control
Freeze on enabled condition - Freeze control on condition occurrence.
Time base transition event enable - Time base transition events are enabled.
Time base selector - Select the time base bit that causes a time base transition event.
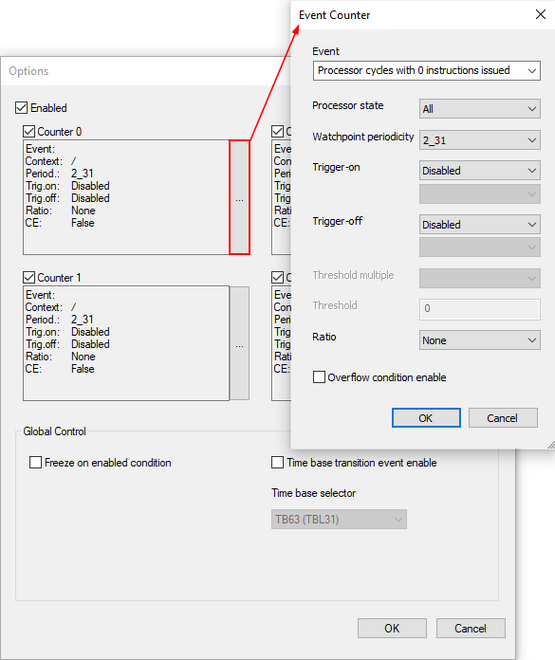
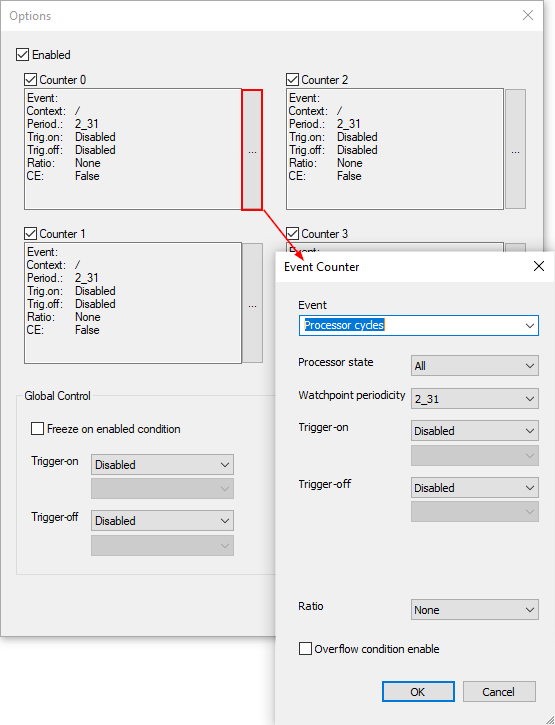
Event Counter dialog - Select the "..." button and configure the Event Counter dialog.
Event - Select an event.
Processor state - MSR-based Context Filtering.
Watchpoint periodicity - The period of asserting performance monitor counter watchpoints.
Trigger-on / Trigger-off - Counter trigger control.
Ratio - Select the ratio between:
•Event Counter n (ECn) and Cycle Counter (CC)
•Event Counter n (ECn) and Event Counter n (ECn)
Overflow condition enable - Allow an overflow condition to occur, when the most-significant-bit of the counter is equal to 1.
Generation 2
Enabled - Enable the PMU unit.
Counter check box - Enable and configure selected Counter.
Global Control
Freeze on enabled condition - Freeze counters on condition occurrence.
Trigger-on / Trigger-off - Global trigger settings.
Event Counter dialog - Select the "..." button and configure the Event Counter dialog.
Event - Select an event.
Processor state - MSR-based Context Filtering.
Watchpoint periodicity - The period of asserting performance monitor counter watchpoints.
Trigger-on / Trigger-off - Counter trigger control.
Ratio - Select the ratio between:
•Event Counter n (ECn) and Cycle Counter (CC)
•Event Counter n (ECn) and Event Counter n (ECn)
Overflow condition enable - Allow an overflow condition to occur, when the most-significant-bit of the counter is equal to 1.
Context menu
Right-click in the plugin window to open the context menu.
Copy Python access snippet - Copy SDK code snippet to extract the content from the plugin window.
Auto Fit - Arrange all the columns to fit in the plugin window.
Options - Set colors and fonts.
Help - Open winIDEA Help.
Examples
Freeze Counters on overflow
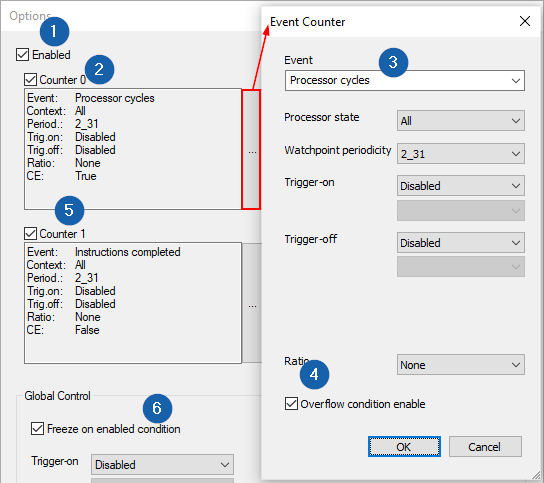
Use the Freeze on enabled condition option and stop a certain counter when it overflows. In this example we will stop the counting when Counter 0 overflows.
1. Open the Options dialog and check the Enabled box.
2. Enable Counter 0 and open its setting via the "..." button.
3. Select an Event - Processor cycles.
4. Check the Overflow condition enable option.
5. Enable and configure Counter 1 for comparison reasons. Set the Event to Instructions completed.
6. Check the Freeze on enabled condition option.
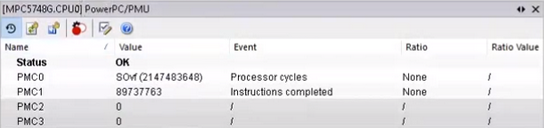
PMC0 stops counting when it overflows.
Global trigger
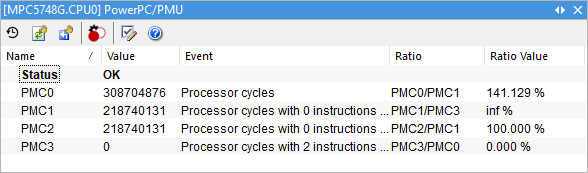
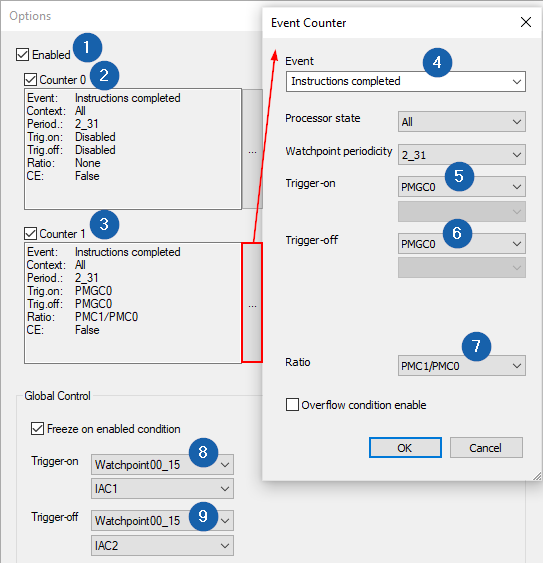
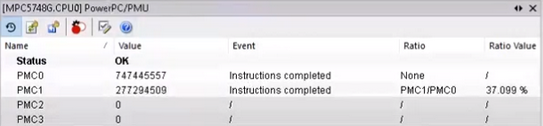
In this example we will measure a ratio of completed instructions in a specified program region to all completed instructions. Counter 0 will count all completed instructions, while Counter 1 will count completed instructions only in the specified region.
1. Open the Options dialog and check the Enabled box.
2. Enable Counter 0 and as Event select Instructions completed to count all the instructions. Make sure Overflow on enabled condition is not checked.
3. Enable Counter 1.
4. Select Instructions completed as Event to count instructions as well.
5. For Trigger-on select PMGC0 to start counting as configured in the global configuration.
6. For Trigger-off select PMGC0 to start counting as configured in the global configuration.
7. Select Ratio to compare the Counter 1 to Counter 0 - PMC1/PMC0.
8. In Global Control / Trigger-on select Watchpoint00_15 and IAC1 to trigger on based on Instruction Address Compare 1 watchpoint occurrence.
9. In Global Control / Trigger-off select Watchpoint00_15 and IAC2 to trigger off based on Instruction Address Compare 2 watchpoint occurrence.
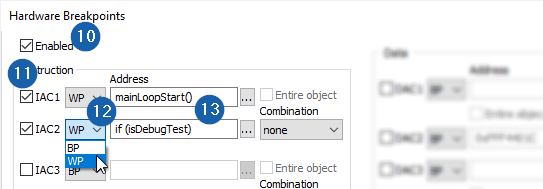
10. Open the Hardware Breakpoints dialog by clicking the  button in the plugin toolbar and check the Enabled box.
11. Enable IAC1 and IAC2.
12. Select WP from the drop-down to behave the instructions as watchpoints.
13. Select the addresses.
Check the results in the window.
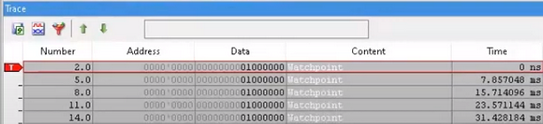
Watchpoint Trace messaging
Each Performance Monitor Counter (PMC) can assert watchpoints. Watchpoints are connected to the Watchpoint Output Signal which can generate Watchpoint Trace messages. Each PMC asserts a watchpoint on overflow and rollover by default, but you can configure this period via option Watchpoint periodicity. In this example we will configure Counter 1 to generate a Watchpoint Trace message on each 2^14 occurrence of the selected event.
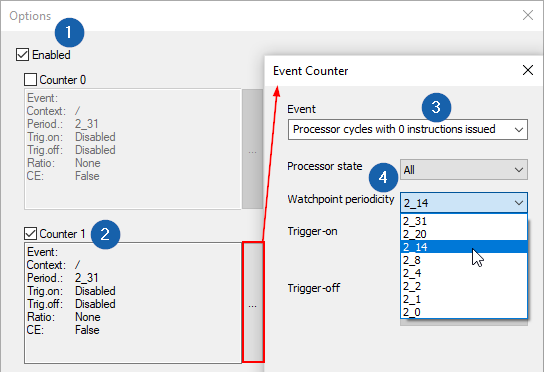
1. Open the Options dialog and check the Enabled box.
2. Enable Counter 1.
3. Select Event Processor cycles with 0 instructions issued.
4. Select Watchpoint periodicity to 2_14.
5. Open Analyzer | Manual Configuration.
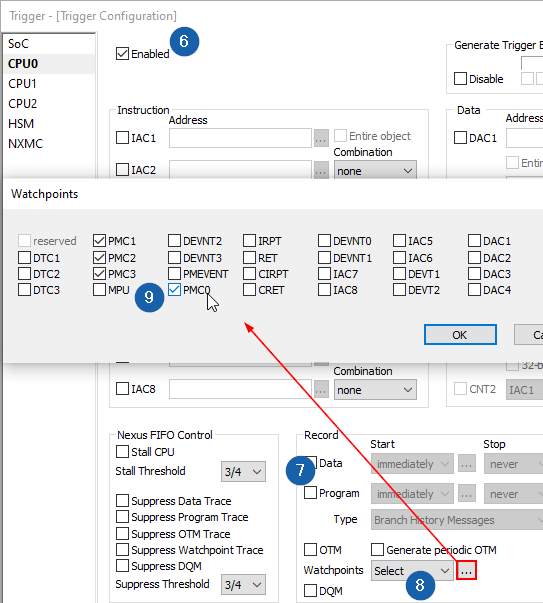
6. On CPU0 check the Enabled box.
7. In the Record section disable Program trace.
8. In the Record section select option Select from the Watchpoints drop-down.
9. Enable PMC0 - PMC3.
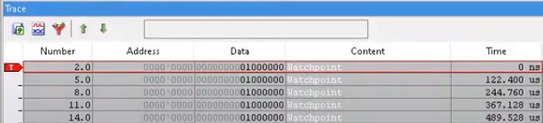
Trace recording with Watchpoint periodicity set to 2_14.
Trace recording with Watchpoint periodicity set to 2_20.