Automatic Trace Configuration
By default Analyzer will automatically configure the hardware based on the events you wish to profile, or code areas you wish to measure coverage on. This is the best method for users who are not familiar with specific CPU architecture.
|
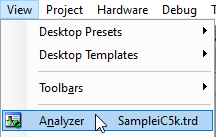
Open the Analyzer. |

|
|
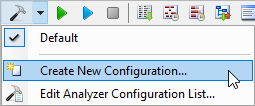
Create a New Configuration. |

|
|
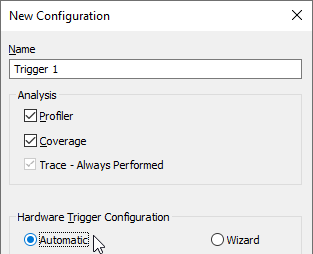
Configure the New Configuration and select Automatic. |

|
|
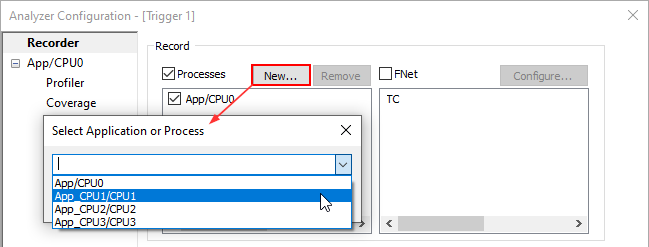
Add a relevant Application/Process via New button. |

 |

