Measurement
In this topic:
Measurement plugin uses the debugger to get basic measurements of the Debug setup. Displayed measurements depend on the capabilities of the debug system.
Select View / Measurement to open the plugin.
 |
Toolbar
Icon |
Description |
|---|---|
 |
Manually refresh information |
 |
Automatically refresh information |
 |
Open winIDEA Help |
Rows information
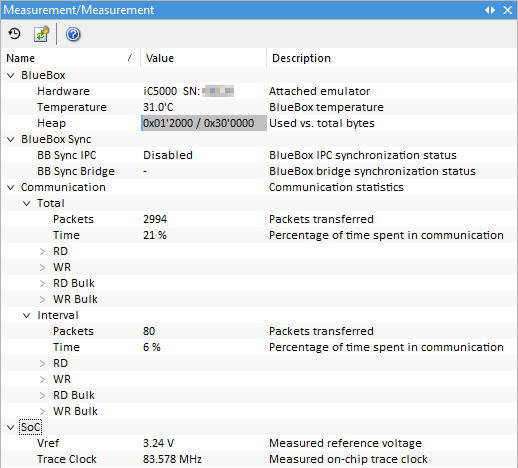
BlueBox
Hardware - Type of attached emulator BlueBox with its serial number
BB Time - Seconds since session start
Temperature - For diagnostic purposes of iSYSTEM support
Heap - For diagnostic purposes of iSYSTEM support
BlueBox Sync
BB Sync IPC - IPC synchronization status
BB Sync Bridge - Synchronization status
Communication - Statistics in Total and in Interval
Packets - Number of packets transferred
Time - Percentage of time spent in common
RD - Size of data transferred, information about bandwidth and latency - for reads
WR - Size of data transferred, information about bandwidth and latency - for writes
RD Bulk - Size of data transferred, information about bandwidth and latency - for "bulk reads"
WR Bulk - Size of data transferred, information about bandwidth and latency - for "bulk writes"
SoC
CPU Clock - Displays the measured CPU / System clock.
Vref - Displays the measured reference voltage from the target board
Trace Clock - Displays the measured on-chip trace clock
LPM Events - Displays the number of observed low-power states
OCD Faults - Displays the number of debug channel transport faults