Renesas RH850
In this topic:
•RH850 Typical Debug/Trace Configurations
•RH850 Specific Debug/Trace Features
The information provided in this chapter is intended to be used together with the CPU reference manual provided by the silicon vendor. This chapter assumes knowledge of the CPU functionality and the terminology and concepts defined and explained in the CPU reference manual. Basic knowledge of winIDEA is also necessary. This chapter deals with specifics and advanced details and it is not meant as a basic or introductory text.
•Setup - General settings to prepare winIDEA for debug session.
•Flash Programming - Additional configuration settings for internal Flash programming.
•Analyzer - Trace, Aurora trace port, Trace templates, Profiler and Coverage.
•Knowledge Base - Specific problems solved.
Getting started
Refer to Getting started Tutorials.
Debug Features
•LPD debug interface •Hardware execution breakpoints •Hardware data access breakpoints •Code & Data FLASH Programming •Multi-core support •Real-time memory access •FLASH Option Bytes programming |
•Security Function •Hot Attach •Stopping peripherals (e.g. TIMERs) when stopped •SFT Software trace •On-chip Trace Buffer (OCTB) support (CPU dependent) •Parallel Nexus trace support (CPU dependent) •Aurora trace support (CPU dependent) |
RH850 Typical Debug/Trace Configurations

Simplified RH850 Debug/Trace Block Diagram
iC5000 – Debug & Software Trace via LPD4
•Basic and compact System
•Debug Access via JTAG/LPD
•Software Trace Support via LPD4
•Trace into On-Chip Trace RAM (on “Large Memory” Devices)
•Optional IOM2 Analog/Digital I/O Module
•iC5000: USB 2.0 / Ethernet

iC5700 – Debug & Nexus Trace
•High-Performance, versatile System
•Debug Access via JTAG/LPD
•Software Trace Support via LPD4
•Trace into On-Chip Trace RAM (on “Large Memory” Nexus Trace Port on Emulation Devices
•Optional Add-On Modules:
oCAN/LIN Use case Configuration
•Nexus Trace Streaming: 16-pin MDO, ½ CPU Clock, Double-Data Rate
•iC5700: 1 GByte Trace Buffer, USB 3.0 / EthernetDevices)

RH850 Specific Debug/Trace Features
The picture below shows a simplified Block Diagram of the RH850 Trace Architecture (without Nexus/AURORA Port).

Software Trace
Software Trace is a RH850-specific trace solution based on Code Instrumentation. Software Trace messages are generated when the CPU executes dedicated instructions, DBCP, DBTAG and DBPUSH. The Software Trace messages can either be stored in an On-Chip trace RAM (if available) or can be streamed out via the LPD4 interface, operating in Software Trace streaming mode.

Timing & Performance Measurement Unit (TPU)
•On-Chip Counter Structure to measure Time (Clock Cycles) and Performance Metrics
•Can be controlled (start/stop) by means of Trigger Event Unit (TEU)
•Counter increment by Stop Events or Debug Clock (JTAG / LPD Clock)
•Optional CPU Break on Counter Threshold and/or Overflow
•Two Sub-Units: Time Measurement & Performance Measurement
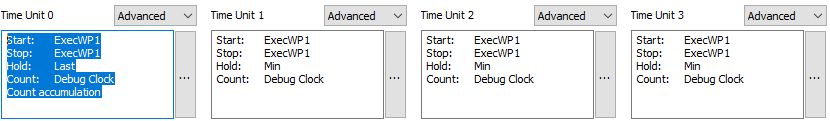
Sample TPU Measurement: Measure Runtime of Function "EE_RUN_Runnable_R1"
•Number of Calls
•Min/Max Execution Time per Call
•Accumulated Execution Time (to calculate average Execution Time)
Unit 0 |
Unit 1 |
Unit 2 |
Unit 3 |
Accumulated Execution Time |
Minimum Execution Time |
Maximum Execution Time |
Number of Function Calls |
ADIO & CAN Trace
A trace recording via the Nexus port allows a time correlation with Analog/Digital or CAN/LIN bus signals captured by means of the ADIO and/or CAN/LIN Add-On Module of the iC5700.
The picture below shows a correlated Nexus Trace and CAN bus recording. The trace was recorded on a Sensor Fusion demonstrator platform, based on RH850/F1H, created within a cooperation project between the companies INCHRON, OpenSynergy and TASKING. The profiler timeline shows a combined trace of CAN bus, program flow, microCOQOS Hypervisor virtual machines and multiple AUTOSAR OS Tasks.

More resources
•Renesas RH850 Microcontrollers landing page