Profiler
In this topic:
•Function Profiling Operation modes
Introduction
Based on the acquired trace information, the winIDEA Profiler can determine:
•How many times an event occurred
•How long did the event last
•The minimum, maximum and average event duration
•The period between consecutive event occurrences
•Sequence of various events
•Time between arbitrary events
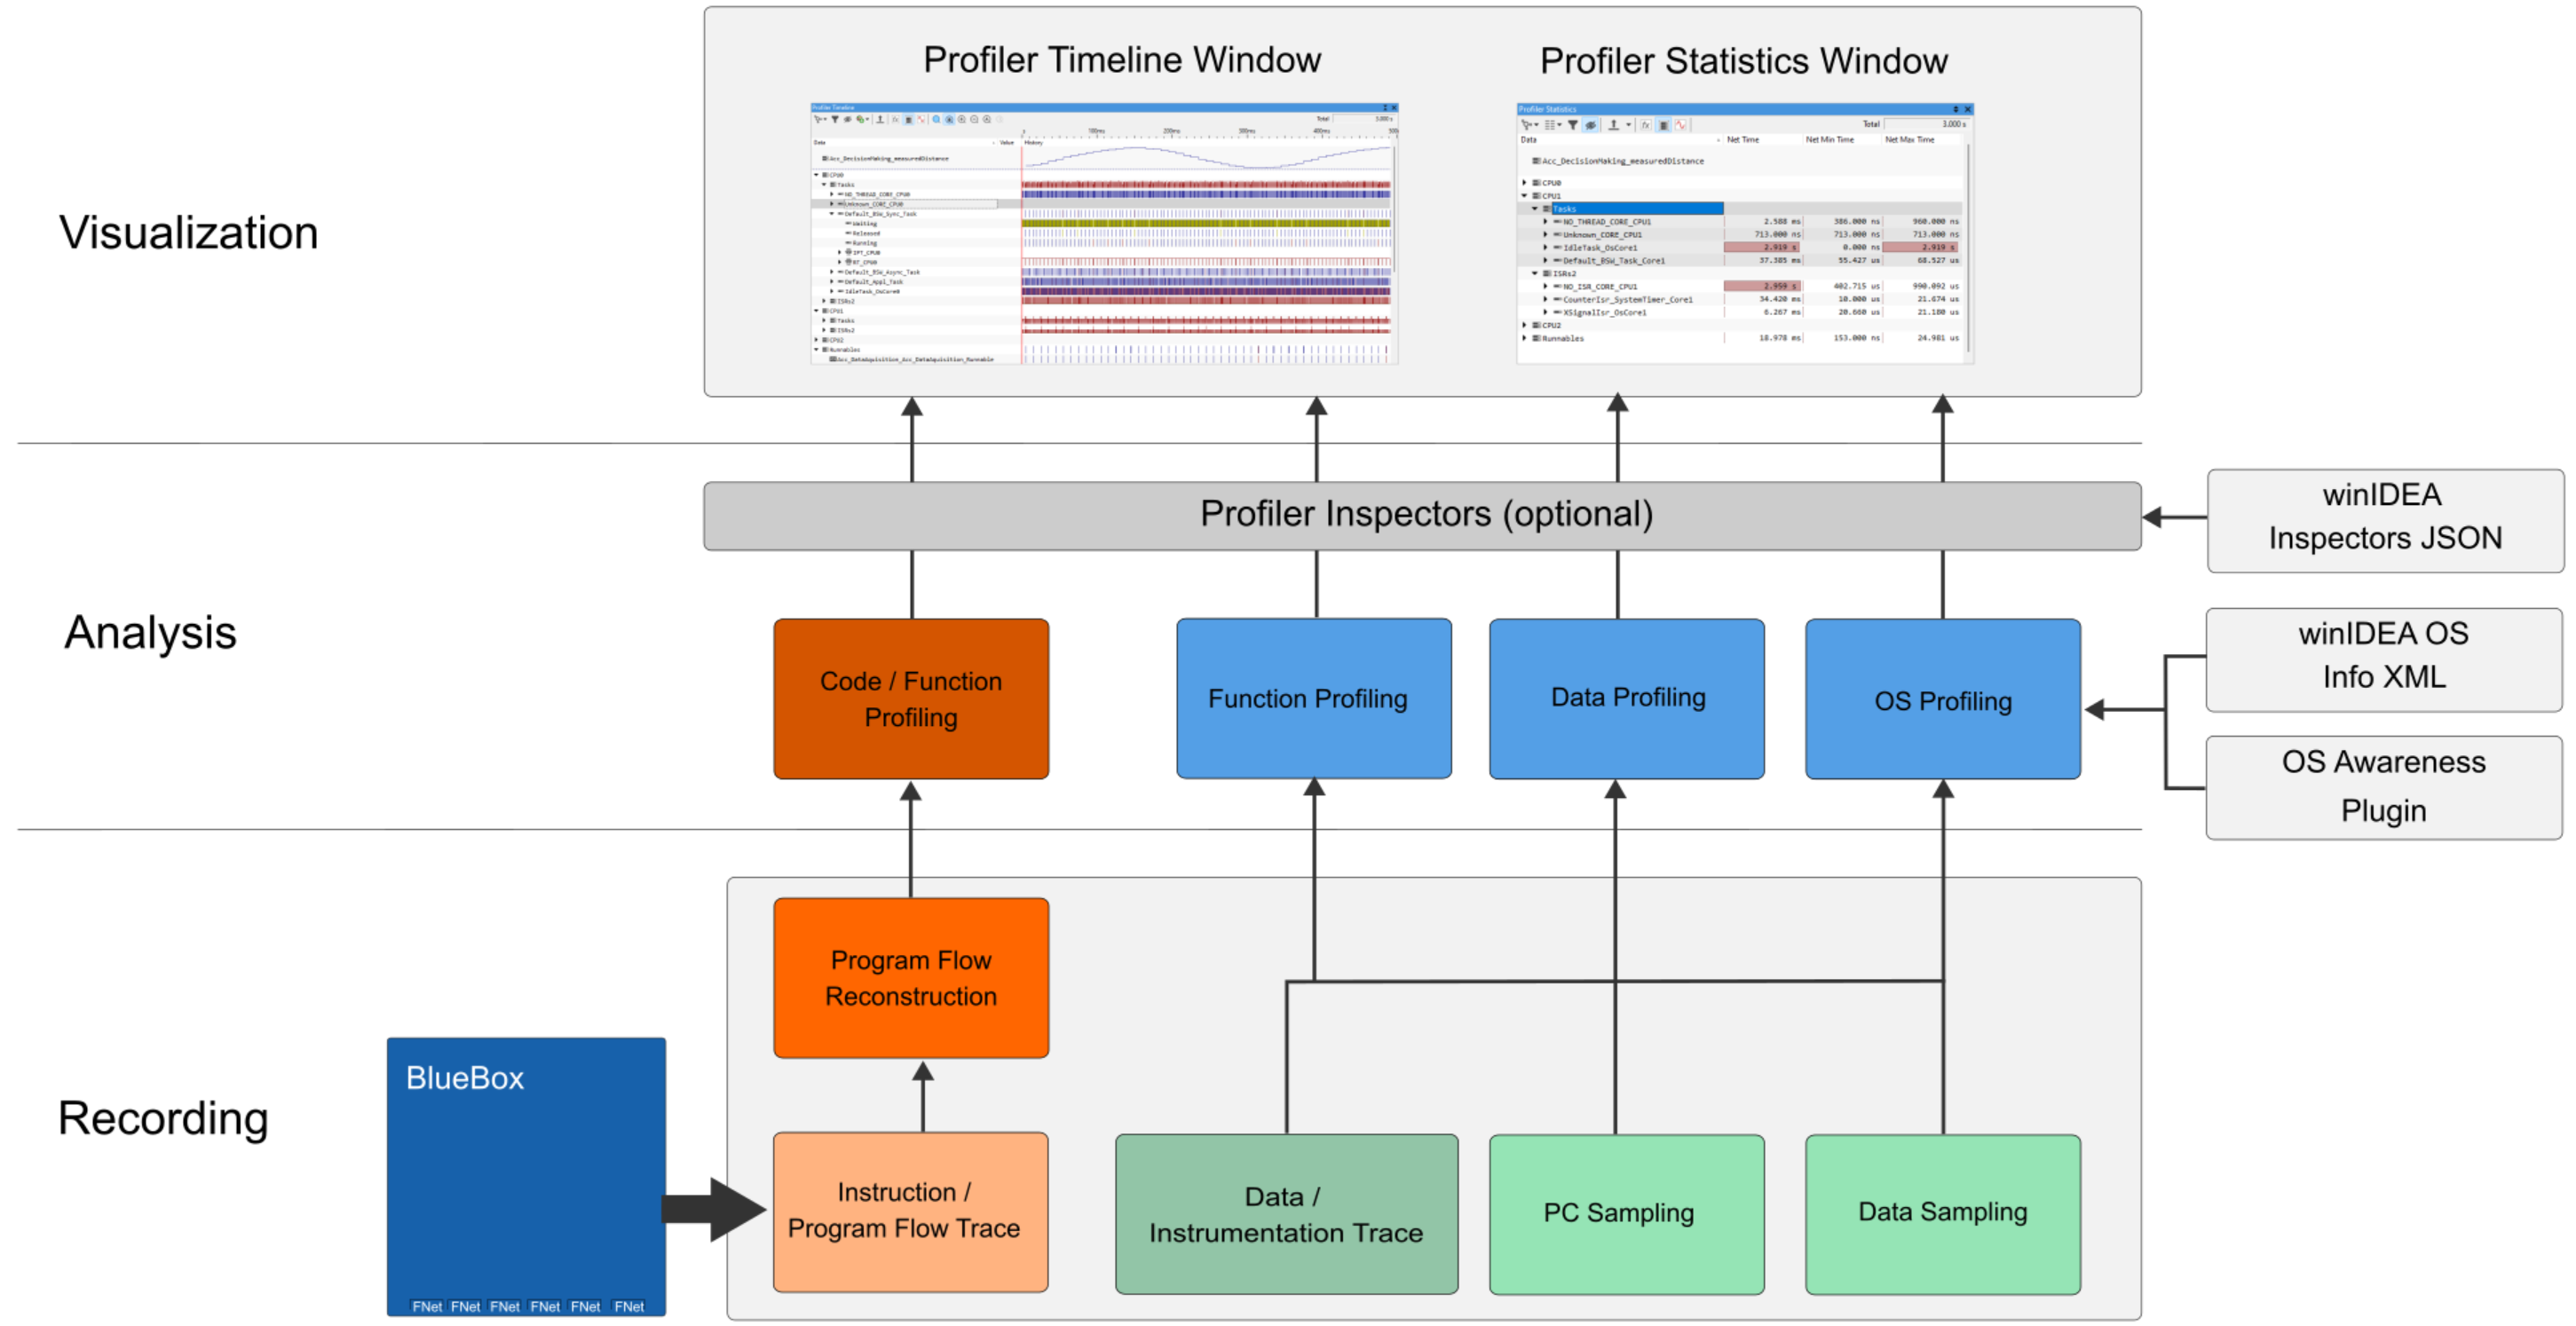
The winIDEA Profiler operates through a structured work flow encompassing three stages:
Recording
This initial stage involves capturing data from the target. Data can be acquired in two ways:
•Captured from the processor via a dedicated trace interface that directly retrieves off-trace data.
•Retrieved through sampling from the debugger interface.
After the recording, the data undergoes decompression and reconstruction to prepare it for further analysis.
Analysis
The Profiler analyzes the reconstructed data to derive detailed insights. It can generate a complete profile of functions and other critical metrics.
Visualization
The results from the Analysis stage are then visualized either in a Profiler Timeline Window or as a list of statistical data in the Profiler Statistics Window, enabling easier interpretation of data.
The Profiler can handle different types of data:
•Instruction/Program Flow Trace: It informs the BlueBox about the discontinuities in software execution such as jumps and branche. Based on this, the BlueBox can reconstruct the runtime program flow and associated timing down to each executed instruction.
•Data Trace: Captures writes to specific memory locations, along with associated timing data. This allows the Profiler to infer various operational insights, such as function entry and exit points (Function Profiling) or task activity in real-time operating systems (OS) like AUTOSAR OS, guided by ORTI files.
•Basic Data Profiling: In addition to detailed tracing, the Profiler supports basic data profiling to capture less complex data patterns and behaviors.
For specialized analysis tasks like Function or OS Profiling, additional data may be required. This is typically supplied via plugins, such as one for reading AUTOSAR ORTI files or through via winIDEA OS Info XML.
Profiler Inspectors
An optional extension are Profiler Inspectors in the Analysis phase that provides user-defined analysis of the captured data. It can be used:
•when default analysis done by winIDEA does not provide enough insight into application execution
•to detect timing violations.
Function Profiling Operation modes
Function Profiling can be categorized into two basic types of analysis:
•Flat Analysis
•Nested Analysis
Flat Analysis
Flat Analysis is a straightforward type of profiling based on the reconstructed program flow. It focuses on the address of each instruction and determines whether the instruction falls within the address range of a specific function. The execution time of each instruction within the range is attributed to the corresponding function. Key points include:
•No function relationship - Flat analysis does not identify relationships between functions.
•Robustness - It is largely unaffected by compiler optimizations, providing reliable results.
•Limitations - The analysis only indicates which function is active at a given time.
Nested Analysis
Nested Analysis recognizes function nesting and can operate in two profile modes: entry-exit mode and range mode.
Entry-Exit Mode
•Function Call Identification - This mode explicitly identifies function calls and returns, constructing a function call stack.
•Compiler Dependencies - It relies on dedicated function call and return instructions being used by the compiler, which may not always be the case due to architectural instructions and compiler optimizations.
•Usage - It is utilized when profiling is not based on program trace but on instrumentation trace, as function entry and exit are marked by instrumentation code and data trace.
Range Mode
•Hybrid Approach - Combines entry-exit and flat mode principles.
•Instruction Address Comparison - Performs comparisons similar to flat mode but includes algorithms for detecting function calls and returns.
•Compiler Optimization Handling - Accounts for various compiler optimizations, such as function tail merging.
•Complexity - Requires in-depth code analysis and understanding of different compiler optimization schemes.
How to set Operation modes, refer to Profiler Configuration.
Call Stack Analysis
Call Stack Analysis (Profiling) is an additional method that can be enabled alongside Range or Entry-Exit modes. It involves:
•Function Call Sequences - Listing all detected function call sequences in the Profiler Timeline and Profiler Statistics Window.
•Application Example - This mode is demonstrated in specific software tools like WinR.
Refer to Perform Call Stack Profiling for a how-to guide.
More resources
