How to Sync Debug & Trace on two Infineon Aurix devices
In this topic:
•Master winIDEA Workspace Configuration
•Slave winIDEA Workspace Configuration
Introduction
For synchronous debugging and tracing of two Infineon Aurix devices, two winIDEA Workspaces have to be created, a Master Workspace and a Slave Workspace. For this use case, each iC5700 is equipped with a Hub and two CAN/LIN Add-on modules, which can also be replaced with ADIO Add-on module(s).
Both iC5700 Hubs are connected via the FBridge cable which enables synchronous debug and trace.
For a general overview, refer to FNet Bridge Multi-SoC synchronization.

Setup with two CAN/LIN Add-on modules
Requirements
•2 iC5700s with iC5700 Hub
•Infineon DAP/DAPE II, Infineon AGBT Active Probes
•2 Infineon Aurix targets
•1 FBridge Cable
•CAN/LIN Add-on modules
•CAN Cable(s)
At least an Active Probe needs to be connected to the iC5700 via FNet.
Hardware Configuration
|
Setup and Configure Hardware for both iC5700s. |

|
Connect both iC5700s via the FBridge synchronization port. |

|
Open the winIDEA Workspace intended to be the winIDEA Master Workspace. |

Master winIDEA Workspace Configuration
You can freely choose which of the two Aurix devices will act as the Master and which as the Slave.
|
Configure the connection with the Active Probe. |
The DAP clock frequency should be set to a high clock rate for an optimized target status polling rate. A high target polling rate improves the sync debug latencies as well as the time synchronization between on-chip timestamp and the BlueBox timestamp. The maximum possible clock rate mainly depends on the DAP signal routing on the target board.
|
Configure the FNet Network description for Active Probe and CAN/LIN. |
|
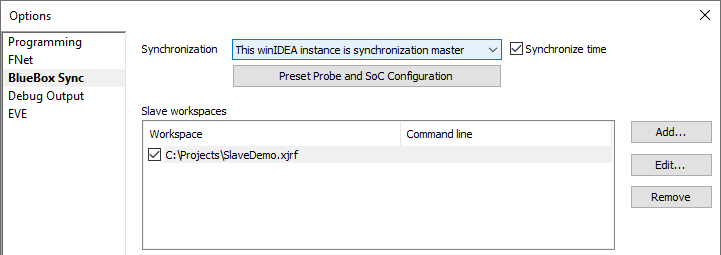
Synchronize the Master iC5700 in Hardware | Options | BlueBox Sync. |
•Select This winIDEA instance is synchronization master from the Synchronization drop-down menu.
•Enable Synchronize time.
•Define the path to the Slave workspace via Add.
|
Perform Debug | Download or Debug | Load Symbols Only. |

The Slave Workspace will open automatically.
After successful download and launch, the Debug Status is shown:
•Master Workspace STOP*
•Slave Workspace ONLINE (ready to ATTACH)
|
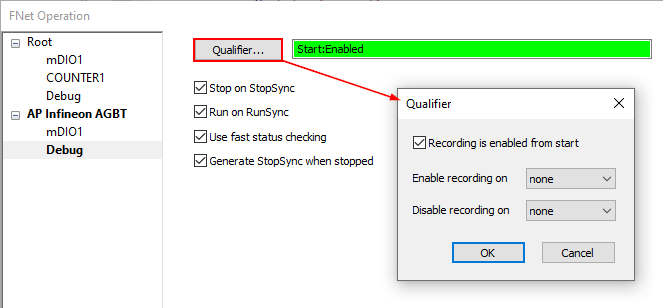
Configure the FNet Operation for the Active Probe in Hardware | FNet Operation | Active Probe. |

•Enable Recording is enabled from the start via the Qualifier button.
•Check all the options to establish synchronization:
oStop on StopSync
oRun on RunSync
oUse fast status checking
oGenerate StopSync when stopped
Slave winIDEA Workspace Configuration
|
Configure the connection with the Active Probe. |
|
Configure the FNet Network description for Active Probe and CAN/LIN. |
|
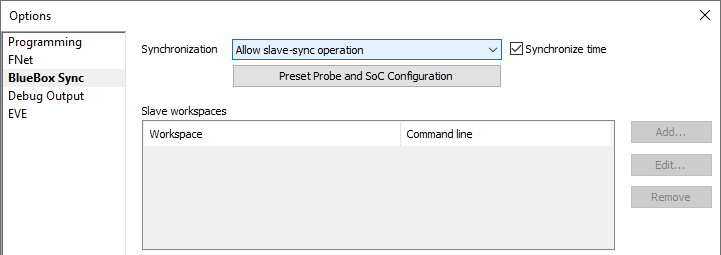
Synchronize the Slave iC5700 in Hardware | Options | BlueBox Sync. |
•Select Allow slave-sync operation in the drop-down menu.
•Enable Synchronize time.
|
Perform Debug | Download or Debug | Load Symbols Only. |
After successful download and launch, the Slave Workspace Debug Status shows be STOP* (same as Master Workspace).
|
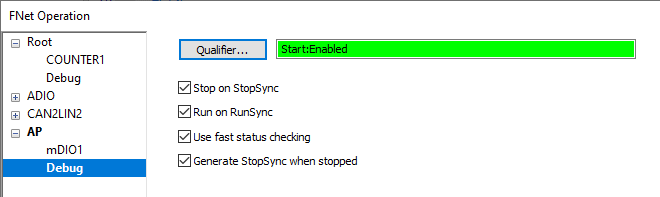
Configure the FNet Operation for the Active Probe in Hardware | FNet Operation | Active Probe. |
•Enable Recording is enabled from the start via the Qualifier button.
•Check all the options:
oStop on StopSync
oRun on RunSync
oUse fast status checking
oGenerate StopSync when stopped
Analyzer Configuration
|
Configure the Recorder in View | Analyzer | Analyzer Configuration. |
•Enable:
oFNet
oProfiler
oTimer Interpolation
oGenerate time synchronization messages
o(for Workspace with Infineon DAP/DAPE II) Upload while sampling
•Start - On Trigger

|
Configure the Manual Hardware Trigger via the Configure button. |
|
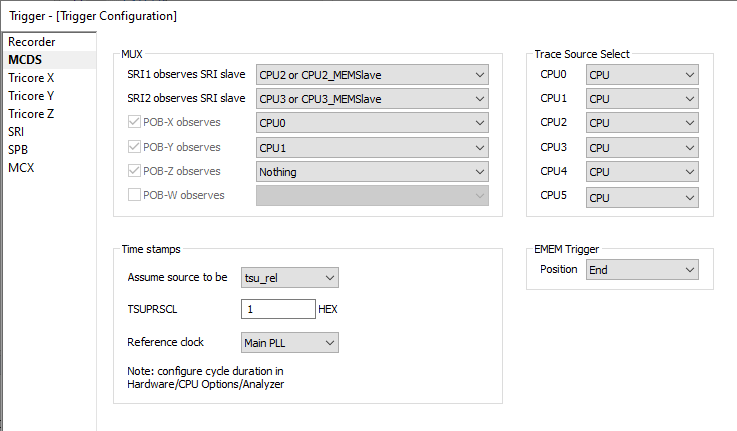
Configure the MCDS page. |
•MUX - Select according to the trace use case.
•Time stamps:
oSource - tsu_rel.
otsu_rel Prescaler value (TSUPRSCL) - Select according to the trace use case. A TSUPRSCL value of 1 yields the maximum trace timing accuracy.
•EMEM Trigger Position set to End. The Emulation Memory of the Aurix target is used as FIFO for the trace data streaming (Upload while sampling) to the iC5700.
|
Synchronized trace only works when using tsu_rel time stamping. TICK time stamping is not supported for synchronized trace. |
|
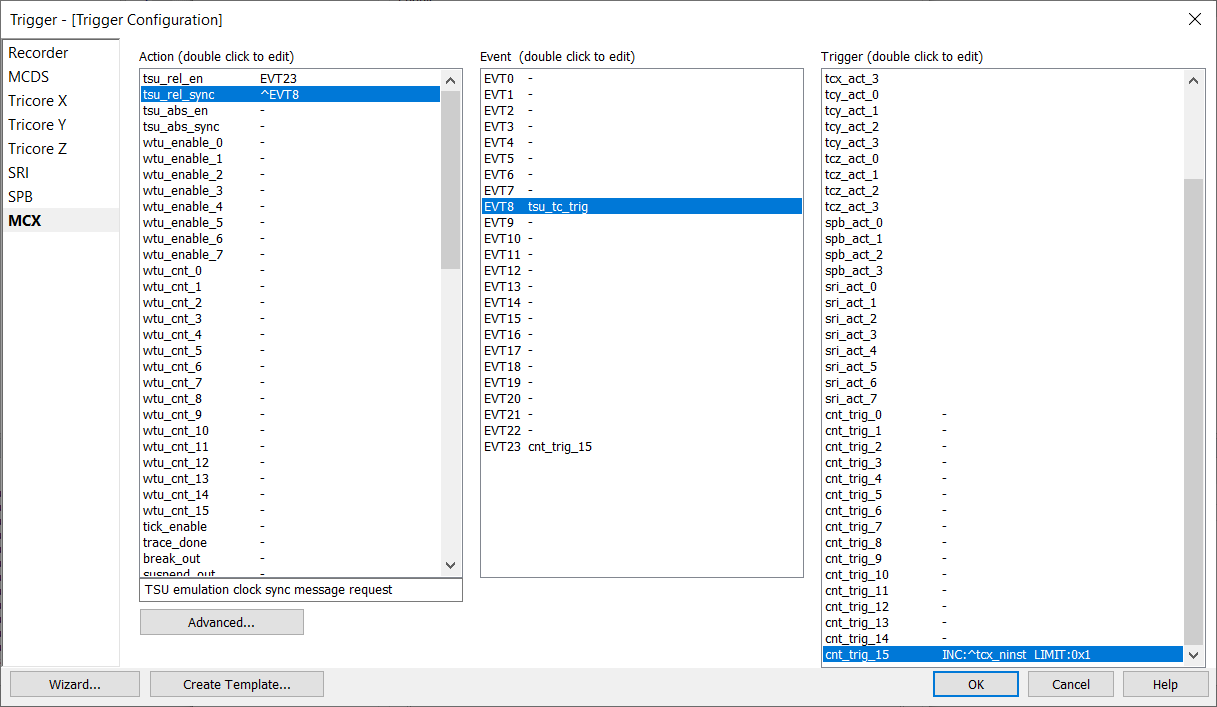
Configure the MCX page. |
•Trigger - cnt_trig_15 MCX counter 15, in conjunction with EVT23, is used to enable tsu_rel time stamp messaging only while the core (attached to POB X) is executing instructions (i.e., is running).
•Event - EVT8 is connected to tsu_tc_trig (i.e., to the TSUPRSCL Prescaler). This means that a tsu_rel time stamp sync message is generated periodically upon every underflow of the TSUPRSCL prescaler.
•Action - trace_done set to NEVER, which is required for Upload while sampling mode.
Synchronized Debug Operation
This section describes the basic synchronized debug operations and its Debug Statuses. The * indicates that synchronized debug is currently active.
Action |
Debug Status |
|
|---|---|---|
Master |
Slave |
|
Download |
[CPU0] STOP* |
STOP* |
Run Master |
[CPU0] RUN* |
RUN* |
Run Slave |
[CPU0] RUN* |
RUN* |
Breakpoint hit in Master |
[CPU0] STOP* |
SUSPENDED* |
Breakpoint hit in Slave |
[CPU0] SUSPENDED* |
STOP* |
Single-Step Operations
Single-Step operations on the Master do not have any effect on the Slave. The Slave remains in SUSPENDED* . While in SUSPENDED* , single-step operations (source-level or assembly-level) are not possible. Single-Step is only possible when the SoC is in STOP* .
For more information about the statuses, refer to Debug Status.
Python script example
The sample Python script below performs the Synchronized Trace Operation. See winIDEA SDK Documentation to be up to date with recent SDK Examples updates.
import os import sys import isystem.connect as ic
mydir = <User-specific Workspace Location>
# Master Workspace location workspaceLocation1 = os.path.join(mydir, 'Demo1/winidea/Tasks_ISR2_States_NoOnInstr', 'demo1_mst_agbt.xjrf')
# Master TRD file name trdName1 = 'demo1_mst_agbt.trd'
# Slave Workspace location workspaceLocation2 = os.path.join(mydir, 'Demo2/winidea', 'demo2_slv.xjrf')
# Slave TRD file name trdName2 = 'demo2_slv.trd'
# Create all necessary Objects to control the Master. cmgr_MST = ic.ConnectionMgr() connectionConfig = ic.CConnectionConfig() connectionConfig.workspace(workspaceLocation1) cmgr_MST.connect(connectionConfig) debug_MST = ic.CDebugFacade(cmgr_MST) ideCtrl_MST = ic.CIDEController(cmgr_MST) traceDoc_MST = ic.CTraceController(cmgr_MST, trdName1, 'w')
# Create all necessary Objects to control the Slave. cmgr_SLV = ic.ConnectionMgr() connectionConfig = ic.CConnectionConfig() connectionConfig.workspace(workspaceLocation2) cmgr_SLV.connect(connectionConfig) ideCtrl_SLV = ic.CIDEController(cmgr_SLV) traceDoc_SLV = ic.CTraceController(cmgr_SLV, trdName2, 'w')
# Adjust BlueBox (iC5700) Time Offset (just needed for aligned display in the Profiler Timeline). outParams = ic.StrStrMap() inParams = ic.StrStrMap() ideCtrl_MST.serviceCall("/IOPEN/HW.HW.GetBBTime", inParams, outParams) timeValue = outParams['Time']
# Adjust Time Offset of Master BlueBox. ideCtrl_MST.setOption_str('/Document/' + trdName1 + '/Loader.HW.Data.TimerOffsetActivation', timeValue) # Adjust Time Offset of Master BlueBox. ideCtrl_SLV.setOption_str('/Document/' + trdName2 + '/Loader.HW.Data.TimerOffsetActivation', timeValue)
# Start Trace Recorder on Master and Slave. Both wait for a common Trace Trigger. traceDoc_MST.start() traceDoc_SLV.start()
# Start Master CPU. This also start Slave CPU due to sync debug setup. debug_MST.run()
# Inject SYNC Trace start on Trigger Channel 1 (i.e. TraceTrig). ideCtrl_MST.serviceCall("/IOPEN/HW.FNet.FTrig_Inject", "TC:1")
# Done. Disconnect from both Workspaces again. cmgr_SLV.disconnect() cmgr_MST.disconnect() |
Profiler Timeline Window
The image below shows the Profiler Timeline windows of a synchronized dual-Aurix trace recording. Besides the trace of the AUTOSAR OS tasks and ISR2s, the CAN frame is also recorded on both SoCs (also synchronized to Aurix MCDS trace).

The next image zooms into a specific section of the Profiler Timeline window of the previous example:
•The top shows the OS ISR2 and CAN bus activities on the Master Workspace.
•The bottom shows the OS thread (task or ISR2) and CAN bus activities on the Slave Workspace.

The scenario shown here is the following:
1.The Master Workspace sends out a CAN frame with ID 0x110. The transmit completion causes a TX ISR2, CANSR0_ISR (blue cursor).
2.The Slave Workspace receives the CAN frame 0x110, issues an RX interrupt, CANSR4_ISR, which spawns an OS thread (i.e. task), Rte_Event_Task. A Runnable within this task (not shown here) responds by sending out a CAN frame with ID 0x111. The transmit completion causes a TX ISR2, CANSR0_ISR (yellow cursor).
3.The Master Workspace receives this CAN frame 0x111 and issues an RX interrupt, CANSR4_ISR (yellow cursor).
More resources