Introduction to the BlueBox Trace Technology
In this topic:
•Software and Hardware tracing
•Trace Technologies - General concept
•What if my CPU does not support trace?
Introduction
Breakpoints and stepping are fundamental debug methods, however, they change software behavior in real-time systems, and cannot observe timings.
Trace is a debug technique that provides a non-intrusive and deepest possible insight into the execution of your application without affecting real-time behaviour. It can be used to:
•debug most difficult, complex code defects
•debug timing issues
•measure and analyze performance
•identify non-tested code by coverage measurement
All of it listed above is based on trace data recordings. Trace data recording is a list of trace events ordered by timestamps. It offers a complete trace of the program execution without affecting real-time behavior.
Software and Hardware tracing
There are two different approaches to acquiring a trace recording: Software and Hardware. It is also possible to combine these two concepts and that’s what we call Hybrid Tracing.
Trace Type |
Pros |
Cons |
|---|---|---|
Software Trace |
No special hardware |
Limited number of objects Limited trace duration Significant overhead |
Hardware Trace |
DMA started/finished RTE communication started/finished CAN message sent/received |
High number of objects Long trace duration No overhead Advanced use cases |
BlueBox, winIDEA, and other software tools focus on the hardware tracing technique.
Trace Technologies - General concept
To do the hardware tracing, we need an embedded target with a microcontroller, a BlueBox Debugger, and winIDEA running on a host computer.
With hardware trace you can record all sorts of information generated by the CPU, such as: Program Trace, Data Trace and Peripheral Trace, as mentioned before. Generated trace messages are read and buffered by the debugger.
Messages get assigned a Time stamp. Depending on the microcontroller that happens either:
•on the microcontroller itself
•externally on the BlueBox at capture time.
Recorded data is then sent to the host PC where trace messages get decompressed, reconstructed and ready for profiling. How to get the data off the chip depends on the hardware.

There are two general techniques to perform hardware tracing:
1. Trace Port - Data is transmitted “off chip” through a dedicated trace port. That’s either a serial or parallel interface. Here, the trace logic directly streams the data to the CPU trace port. The BlueBox captures these messages and buffers them in its own large internal buffer. After that, they continue their way to the host PC.

2. On-Chip Trace Buffer (OCTB) - Microcontroller buffers the trace messages in a dedicated trace buffer, that’s “on the chip”. It’s usually called OCTB, or On-Chip Trace Buffer. The trace messages are temporarily stored in this buffer and the debugger reads out this data through the debug interface. Then the data continues its way into the PC and winIDEA.

For more information refer to Trace Technologies.
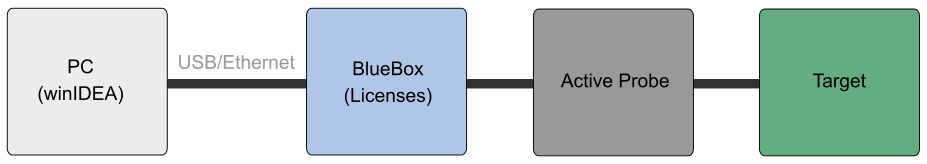
Environment setup
A typical setup for tracing embedded software with winIDEA consists of PC with winIDEA, iC7max/iC5700 BlueBox, Active Probe, and Target. License is programmed into the BlueBox.
For more information about iC7 BlueBox Debugger family and it's trace capabilities, refer to the Comparison table.
winIDEA Analyzer
winIDEA Analyzer is a powerful tool that enables debugging with the assistance of a hardware trace, which can record various information generated by the CPU. Analyzer combines trace, profiling and code coverage measurements in one window. Captured trace data can be exported for post processing by third party tools.
Analyzer window provides three different views:
•Trace is the primary window of the Analyzer and it shows you trace sample numbers, associated addresses, raw data, the decoded data in a readable form, and the corresponding time stamp information for each trace item.
•Profiler provides timeline and statistic information based on the traced data.
•Coverage displays which parts of the code have been executed and tested.
For more information, refer to Analyzer.
What to record?
What can be recorded with the BlueBox tools and how you can pinpoint interesting activities in an otherwise long trace session? With so-called events.
An event is anything going on inside of your application. These events can be categorized into multiple groups, e.g. program trace, data trace, and peripheral trace.
Events of interest
BlueBox trace tools can record various information generated by the CPU, e.g.
•Program execution - Trace records how the program was executed, to the granularity of single instructions. In case of conditional instructions it can most often even record how the instruction has executed (e.g. if the instruction condition evaluated to true or false). Program execution trace is instrumental in finding bugs in real-time execution, measuring code performance and in code coverage.
•Data access - Trace records accesses to memory (typically write accesses) and provides the address and the value which was stored to it. Data trace is typically used for data acquisition and OS event profiling.
•Instrumentation messages - Found on some on-chip trace architectures, the application can use special op-codes or writes to dedicated register(s), to generate these trace messages. This can reduce the amount of trace data considerably, and is usually the only trace available on low-end on-chip trace implementations.
•Other CPU activities - Apart from the above activities, the CPU might implement some advanced trigger functionality, which will generate a watchpoint message when a certain complex condition is met, some CPUs can signal entry and wake up from low power mode state... These features depend on the architecture.
•Auxiliary events - Next to the trace stream originating from the CPU, a debugger can provide auxiliary inputs which can be traced alongside CPU. The advantage here is that events inside the CPU can be well correlated to events outside the CPU. The auxiliary inputs are typically digital, but analog signals or network protocol messages can be traced too.
•Time - One of the most important parts of the trace is a real-time timestamp assigned to every event as it is recorded. This can be either generated by the CPU (particularly when recording to an on-chip trace buffer), or by BlueBox & winIDEA tools when the trace messages generated by the trace port is recorded. Without a timestamp mechanism, real-time analysis and performance measurement is not possible.
Group |
Events |
Program Trace |
Code call, Jump, Return, Branch |
Data Trace |
Memory write/read |
Peripheral Trace |
DMA started/finished RTE communication started/finished CAN message sent/received |
Qualifier
Modern CPUs run at high frequencies and can therefore generate a lot of trace information. Despite trace stream compression on modern on-chip trace architectures, well over 100MB/s of data can be generated for a single-core running at 100MHz. A faster SoC with multiple cores will generate yet more data. This poses a problem when recording trace to an on-chip trace buffer (where available memory is extremely limited) or even when using a trace port which might not be able to handle such bandwidth. Without any filtering mechanism, the trace session would inevitably be limited in time, and the high-level analysis would take a lot of time (when Analyzer needs to process longer trace sessions).
To reduce the trace data bandwidth architectures implement a qualifier condition, which defines what trace data is recorded and what gets discarded. The qualifier can be used to record e.g.:
•only program flow (data trace would require higher bandwidth)
•only certain function execution (if you need to record longer sessions in an on-chip trace buffer)
•data writes to a certain address range (as recording all data accesses generates too much trace traffic, because the compression algorithms are not as effective)
•data writes to a particular variable with a particular value range
|
Qualifier can be configured automatically based on the areas listed in the Profiler Configuration and Coverage Configuration windows, or manually by directly configuring the available trace logic. |
Trigger
By default, winIDEA & BlueBox tools will trigger immediately and start recording all the trace data generated by the CPU as soon as the trace session is started. Once the trace buffer is full, the recording will stop.
This is not desired when the activity of interest occurs infrequently - it could happen that the recording will already stop by the time the relevant part of the application is executed.
Instead, winIDEA & BlueBox tools can wait for the CPU to generate a trigger signal, which indicates that relevant content will follow. The trigger can be generated by various means, most commonly as a special signal which is routed through the debug connector. The trigger can be caused by various events, most commonly:
•execution of a certain instruction (e.g. entry to a function)
•data write to a specific address (e.g. task entry)
Until the trigger signal is received, recorder will keep overwriting the old trace data in the trace buffer. Please refer to Recorder Configuration chapter to learn about different possibilities for trigger configuration.
What if my CPU does not support trace?
Many CPUs do not have any trace capabilities (no Trace Port or On-Chip Trace Buffer, as these make the device more expensive). In such cases, you can use:
•Emulation Adapters - Available for some architectures, which features a bigger CPU package (this is only possible when such bigger, super-set device is available). The BlueBox tools connect directly to the emulation adapter, and emulation adapter is connected to the target hardware through the pin count conversion board (which is the same format as the smaller MCU package). In some cases the bigger CPU package might already have the trace capabilities, which you can use directly.
•Sampling - With this approach you can periodically sample variables (data variables or program execution) via a debug port. Concept of Profiler Sampling is mainly used for statistical analysis or for sampling rather slowly changing variables, and cyclic program execution.
•Software trace - Some CPUs (e.g. RH850) support special instructions, which generate messages on the debug port. The application must be instrumented to generate these messages and the trace method is therefore called Software trace.
•Slow Run - Method in which the application is executed by stepping through the application. This method does not support real time execution (and even disables the interrupts while the application is being run). This means it is not appropriate for system testing, but can be used to measure statement coverage on small scale (e.g. during unit testing).
More resources
•What is Trace - Video Tutorial
•Introduction to Tracing - Webinar