Profiler Statistics Window
In this topic:
Introduction
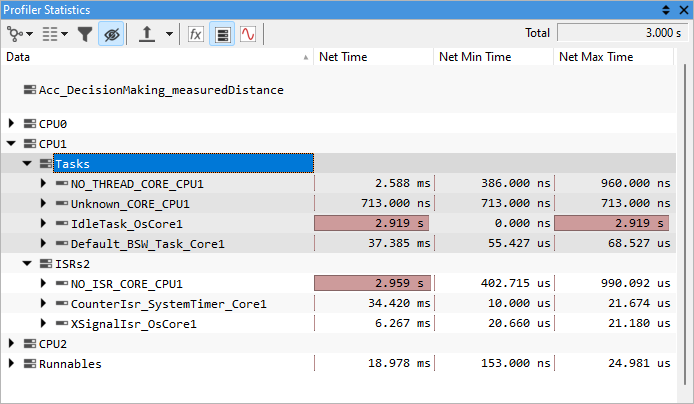
Profiler Statistics window offers different types of statistics information:
•Interval Statistics
•Area Statistics
•Session Statistics
Profiler Statistics is enabled by clicking the Profiler Statistic button  in the Analyzer toolbar.
By default the whole recording is analyzed to obtain Profiler statistics. This can be limited/filtered either by:
•Specifying the session time limit in the Profiler configuration or
•Using Area Statistics
Toolbar
Most toolbar commands are also available from the context menu.
Icon |
Description |
|
|---|---|---|
|
Current Task |
Select the context you wish to analyze. Read more in chapter Context Selection. |
|
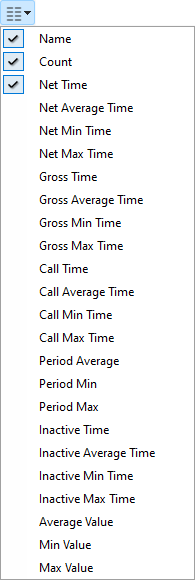
View Column |
Display columns for Automatic measurements: Count, Net Time, Gross Time, Call Time, Period, Inactive Time, Value |
|
Filter items |
Opens a combox for Filter configuration. Read more in Profiler timeline Filtering. |
|
Hide items with no activity |
Hides all areas with no activity. Read more in Profiler timeline Filtering. |
|
Export |
Export the data. |
|
Show code |
Toggle function events. |
|
Show data |
Toggle data events. |
|
Show aux |
Toggle AUX events. |


Automatic measurements
You can select which columns you wish to see by right-clicking the column row and selecting the desired columns from the context menu or by pressing the View Column from the Profiler Statistic toolbar.
By default only Name, Count and Net Time are shown.
Profiler Interval Statistics offers a selection of automatic measurements:
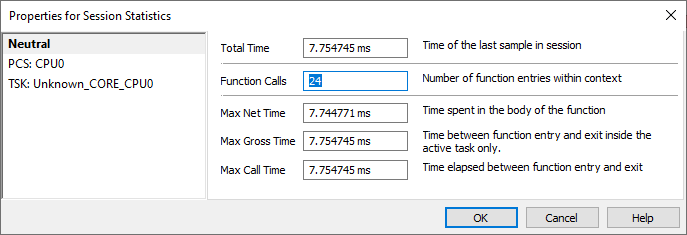
Session Statics
Session Statics shows the sum of function inside of a certain context (task).
To open Session Statistics are right-click an area in the Profiler windows and select Session Statistics.
More resources
•Getting started with Trace - Tutorials
•Knowledge Base - Troubleshooting tips and tricks