Profiler Timeline Window
In this topic:
Introduction
The gathered profiled data is displayed on the Profiler Timeline, where you can easily see how various events correlate to each other. It can optionally be exported to various formats.
Profiler Timeline is enabled by toggling the Profiler Timeline button  in the Analyzer Toolbar. Profiler Timeline window can be renamed by right-clicking on window page.
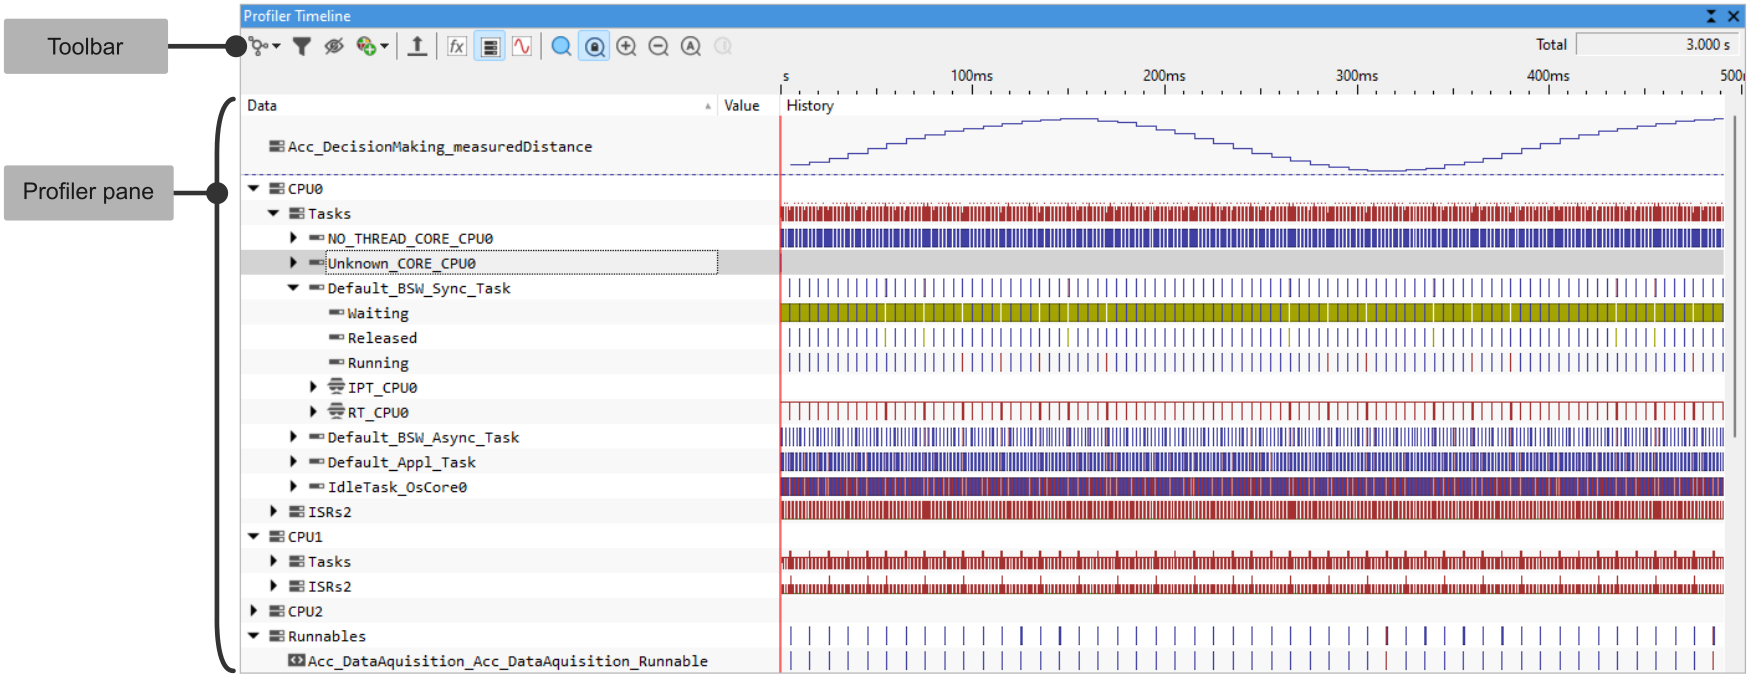
Most toolbar commands are also available from the context menu.
Icon |
Description |
|
|---|---|---|
|
Current Task |
Select the context you wish to analyze. Read more in chapter Context Selection. |
|
Filter items |
Opens a combox for Filter configuration. Read more in Profiler timeline Filtering chapter. |
 |
Hide items with no activity |
Hides all areas with no activity. Read more in Profiler timeline Filtering chapter. |
|
Post Process |
Configure Inspectors. |
|
Export |
Export the data. |
|
Show code |
Toggle function events. |
|
Show data |
Toggle data events (variables, OS States, instrumentation). |
|
Show aux |
Toggle AUX (IO signals, network messages) events. |
|
Find |
Find an item by name. Read more in Profiler Timeline Searching chapter. |
|
Snap area on Find |
If enabled, the result of Find will be snapped into view. Read more in Profiler Timeline Searching chapter. |
|
Zoom In |
Zoom in the timeline from selected position (black line) |
|
Zoom Out |
Zoom out the timeline from selected position (black line) |
|
Zoom All |
Zoom the entire timeline. |
|
Zoom in between Marker 1 and Marker 2 |
Zoom in the area between selected markers. |


Timeline color coding
The first column displays the area name and the column Value shows the AUX/data value at the caret position.
Shape / Color |
Applicable Area |
Activity |
|
|---|---|---|---|
|
Block / Red |
Function, State, Task |
The area is active (function executing in body, state is active, task is running). |
|
Block / Light Red |
Function, Task State |
The area is suspended (function called another function, a task was preempted). |
|
Block / Blue |
Function, Source Line, State |
Multiple activities within a single display pixel. Zoom-in to get more information. |
 |
Block / Dark yellow |
Task |
Except tasks in the running state. |
 |
Block / Green |
State |
The State variable is in the neutral state (no task is executing). |
|
Line / Red and Green |
Data (state variable) |
The data variable of state type shows state flow. Red lines indicate active states, green the neutral state. |
|
Line / Blue |
Data |
A data variable of regular type, state variable without neutral value, AUX flow. |


Context menu
Right-clicking in the area of Profiler Timeline window open context menu.
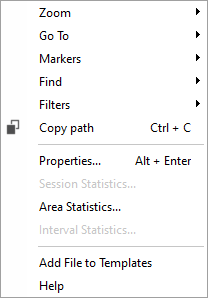
Zoom -Zoom in, out, all and zoom between markers.
Go to - Move to position of Marker 1, Marker 2, Caret, Start, End, Trace, Next Bookmark, Previous Bookmark, Source, Dissasembly.
Markers - Set Marker 1 and Marker 2, Toogle Bookmark, Clear Bookmark, Remove Markers.
Find - Search for an item by name; search for previous/next. an item by name.
Filters - Add to filter or create new filter.
Properties - Open a dialog for the various statistics available.
Session Statistics - Opens dialog Properties for Session Statistics.
Area Statistics - Opens a new window Profiler Statistics for Area [name,file] where it is possible to define an area (e.g. function, variable state, OS task, Profiler Inspector state...) which will be used as a time-based filter for the Profiler Statistics.
Interval Statistics - Opens a new window Profiler Statistics: [Interval] to display timing statistics between two markers.
Insert File into Project - Insert Source file, Build file or HW into the project.
Add File to Templates - Create new template. Current file will be saved before creating a new template.
Find dialog
You can open this dialog, by selecting Area in the Profiler Timeline page, and clicking the Find button  the Profiler Timeline Toolbar.
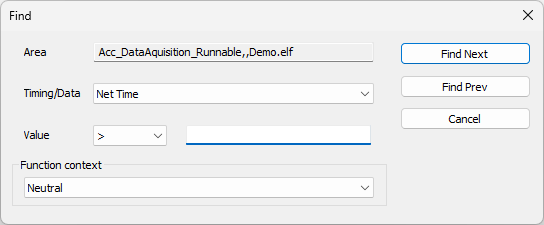
Area - Selected area/task in the Profiler Timeline.
Timing/Data - See Statistics Properties.
Function context - See Context Selection.
Context Selection
If an operating system is running on the embedded target, analyzer can be configured to record task switches, so that the program flow can be correctly reconstructed. In such case click the Context button  and select the context you wish to analyze. Note that Profiler creates one additional context for each core (called unknown_<coreID>), to which it attributes all events that happen before the OS task is first signaled.
A core can be selected via Current task drop-down in the Profiler Timeline window:
•Neutral - All cores are merged and displayed in one timeline.
•PCS: CPU Name - Context for a specific core.
Configuration options
Refer to Profiler Configuration.
Exporting the trace data
Profiler Export dialog allows you to export the profiled data in various formats: CSV, BTF, MDF, XML, Text1, HTML. For more information, refer to Profiler Export.
More resources
•Getting started with Trace - Tutorials
•Search in the Profiler Timeline - How-to guide
•Filter in the Profiler Timeline - How-to guide
•Knowledge Base - Troubleshooting tips and tricks