Trace Window
In this topic:
Introduction
Trace provides deepest possible insight in the real-time workings of the application. The quality of captured information depends on trace capabilities of the CPU and the used trace tool.
Once you have the trace recording, you can open the Trace Window by selecting the Trace button  in the Analyzer toolbar.
Toolbar
Icon |
Description |
|
|---|---|---|
|
Export |
Export data. |
|
Configure Signals |
Opens a dialog for Signal configuration. |
|
Configure States and Filters |
Opens a dialog for State and Filter configuration |
|
Go to First Function Sample |
Caret is moved to the first op-code executed in the current function body – i.e. when execution entered the range, either as it was called or a called function returned to it. If the caret is already located on the first sample in a function, then the caret is moved to the previous last sample in the current function – i.e. when the function exited or called another function. |
|
Go to Last Function Sample |
Caret is moved to the last op-code executed in the current function body – i.e. before the execution moves to a different function wither as a call or return. If the caret is already located on the last sample in a function, then the caret is moved to the next first sample in the current function – i.e. after the called function returns or the function is called again. |
|
Location box |
The Location box in the trace window toolbar indicates the function to which the indicated instruction belongs. Use the arrow buttons to move between instances of this function. |


Column information
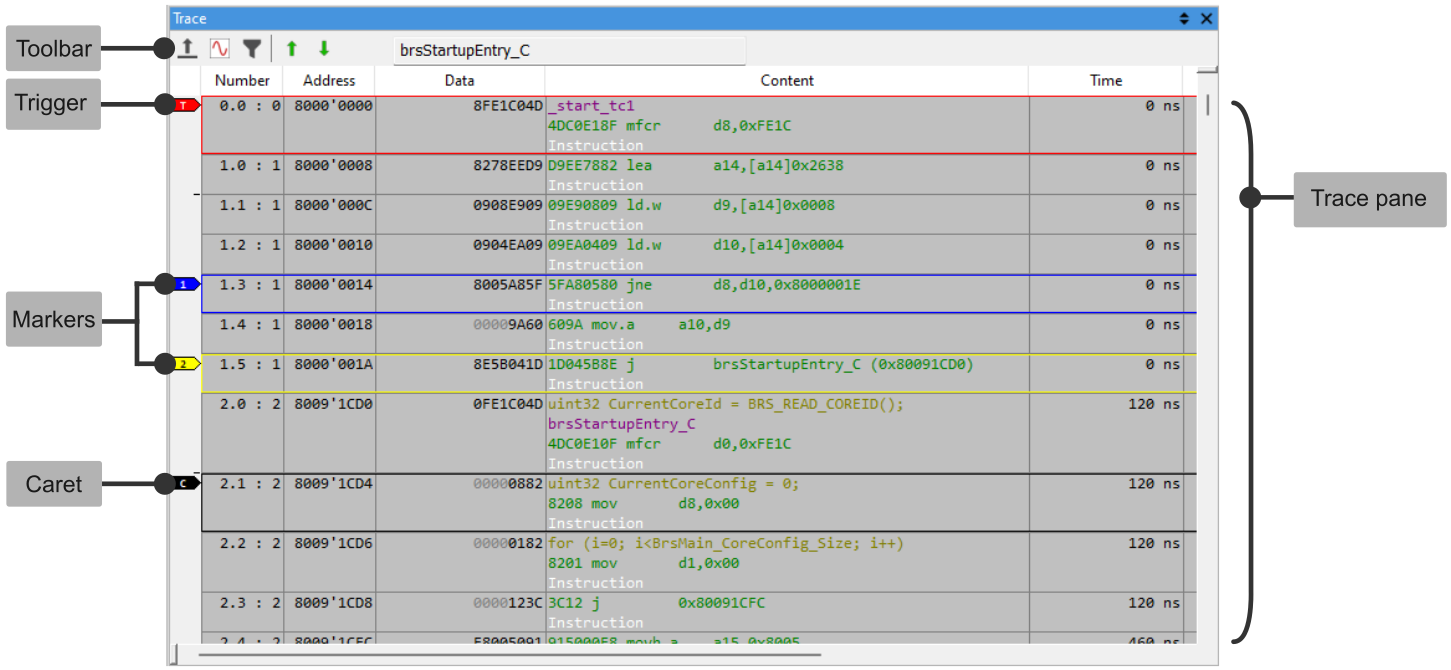
Number - Trace sample number, relative to the trigger position. On on-chip traces where multiple actions of the CPU are packed into a single message, the number is encoded as <sample.subsample>
Sample is the trace message count since the trigger.
Subsample is the index of the CPU activity within a single message. In this picture, where on-chip-trace data display is enabled, it is shown how a Nexus IBHM message is decoded into program flow.
Address - Associated address of a trace item:
oOp-code address
oAddress of data access
oAddress or part of address encoded in the trace message
Data - Associated data of a trace item:
oOp-code
oValue of a data access
oData or part of data encoded in the trace message
If only a part of data is valid (e.g. 8-bit data access on a 32-bit CPU), the ignored bits are displayed grayed.
Content - Displays the decoded trace item in readable form. The text depends on the trace item class.
Time - Time of the trace item.
Find dialog
The Find dialog is opened with the CTRL+F keyboard shortcut while Trace Window is focused.
Use F3 to move to the next hit.
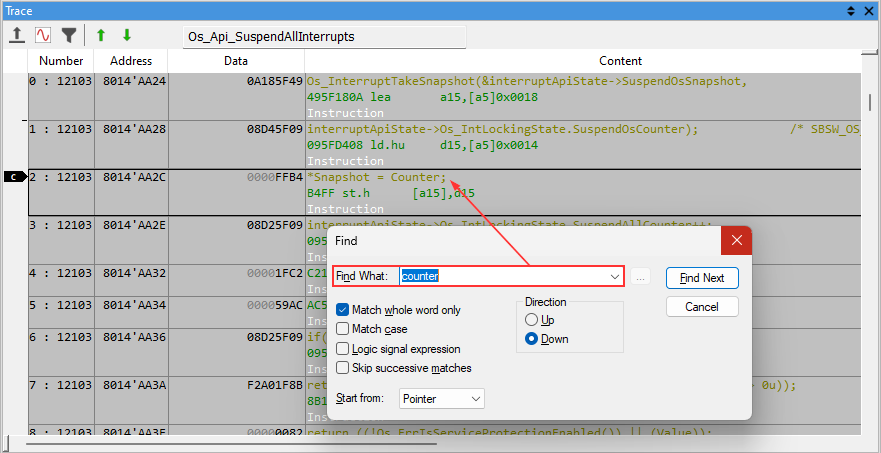
By default the search operates by string search in the Content column, e.g, ETM.
Match whole word only - If enabled, the search string searches the whole word.
Match case - If enabled, the search string is case sensitive.
Logic signal expression - If enabled, search is performed in other columns.
Skip successive matches - If enabled, search skips to search groups.
Direction - Select an up or down search direction.
Start from - Select from which point the search will start (Pointer, Trigger, Buffer start, Buffer end).
Context menu
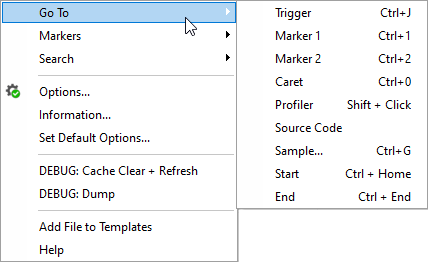
Search - See Find dialog.
Options - See Options.
Information - See Recording information.
Set Default Options - Uses current options when creating a new document.
Add File to Templates - Saves this TRD as a template.
States and Filters
You can open this dialog by clicking the button in the Trace Window Toolbar.
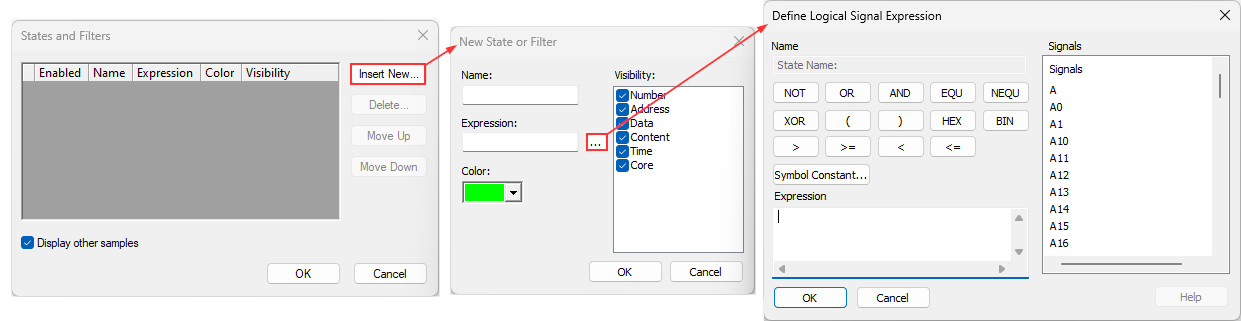
In the New State or Filter dialog, you can define:
Name - Select a meaningful name.
Visibility - Selection allows you to mask specific columns in the filtered results
Display other samples - If disabled, only the filtered items will be shown.
Expression button to open the Define Logical Signal Expression dialog
In the Define Logical Signal Expression dialog, you can define:
Expression - This will be used for your filter.
Symbol Constant - Opens the Symbols Browser.
Configuration options
Refer to Trace Configuration.
Exporting the trace data
The Trace Export dialog allows you to export the trace data in various supported formats: Text, CSV, HTML, Binary. For more information, refer to Trace Export.
More resources
•Getting started with Trace - Tutorials
•Filter in the Trace Window - How-to guide
•Search for complex Expressions in the Trace Window - How-to guide
•Knowledge Base - Troubleshooting tips and tricks