Profile Code
In this topic:
Introduction
This tutorial demonstrates how to create Automatic Hardware Trigger, select correct Application (or Process), and configure Profiler Area.
Configuration steps
Make sure your winIDEA workspace for tracing is created and debug session established.
|
Open View | Analyzer | Analyzer Configuration arrow | Create New Configuration. |
|---|

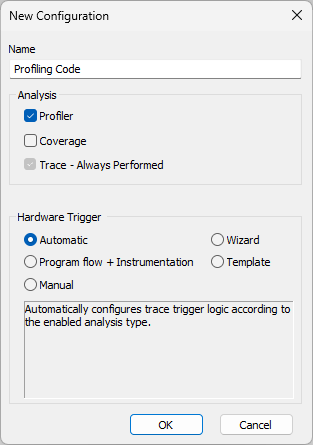
The configuration should have:
a.Descriptive name
b.Enabled Profiler
c.Enabled Automatic Hardware Trigger
|
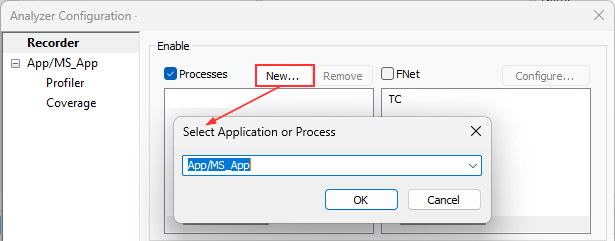
Select your Process (Application). |

When you click on the newly created Process (e.g. App/MS_App), Profiler (and Coverage) pages will appear in the left menu.
|
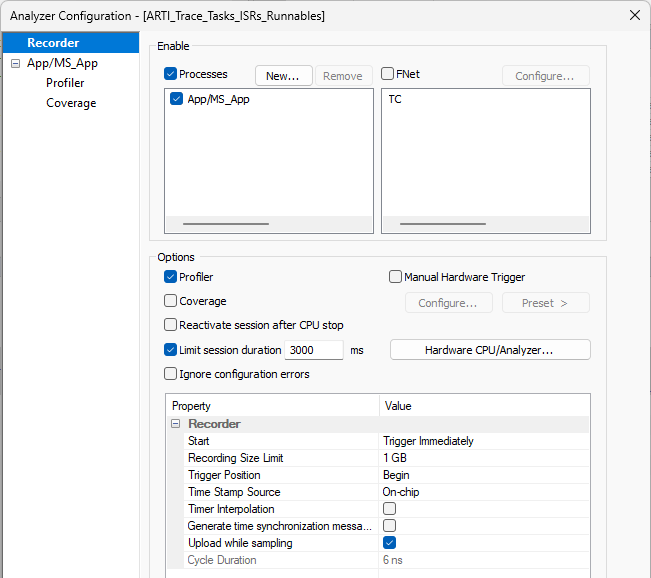
Set Recorder options. |

•Start - Trigger Immediately
•(optional) Enabled Upload while sampling to stream trace messages via the DAP interface
|
Make sure Manual Hardware Trigger is not checked. |

|
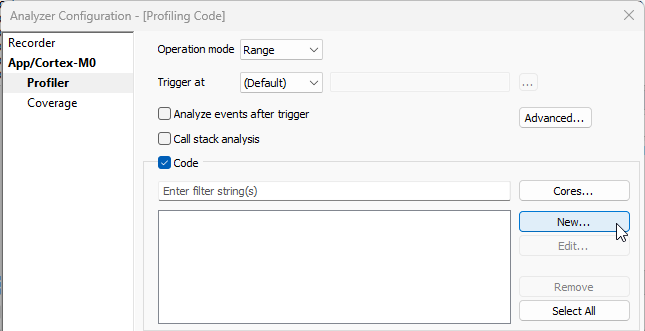
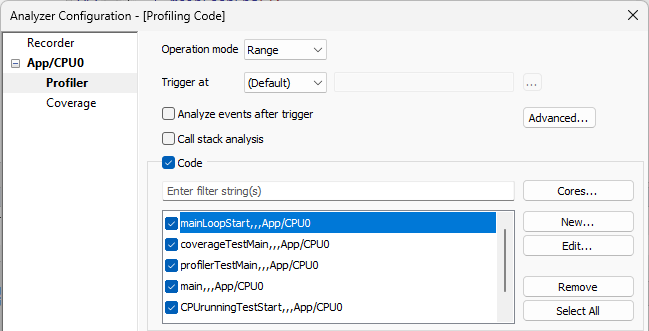
Select Code and click New to define Profiler Area in the Profiler page. |

If Code Areas section is left empty, all functions listed (reported) in the debug download file(s) are recorded.
It is recommended to profile only functions of interest since this yields faster Profiler analysis.
|
Define Functions you wish to record and confirm. |


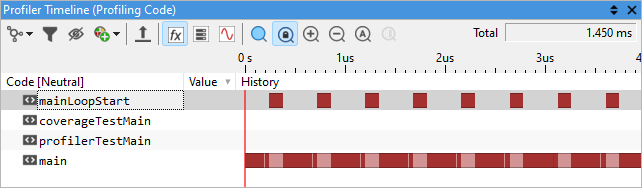
Results
More resources