Profile Data
In this topic:
Introduction
This tutorial demonstrates how to create Automatic Hardware Trigger, select correct Application (or Process), and configure Profiler Areas. The objective is to track how a single variable is changing over time.
Configuration steps
Make sure your winIDEA workspace for tracing is created and debug session established.
|
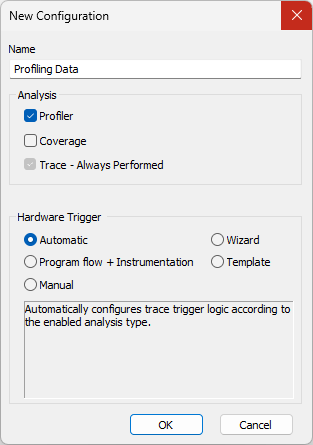
Create a New Analyzer Configuration via View | Analyzer | Analyzer Configuration arrow | Create New Configuration. |

The configuration should have:
a.Descriptive name
b.Enabled Profiler
c.Enabled Automatic Hardware Trigger
|
Add a Process via New button. |

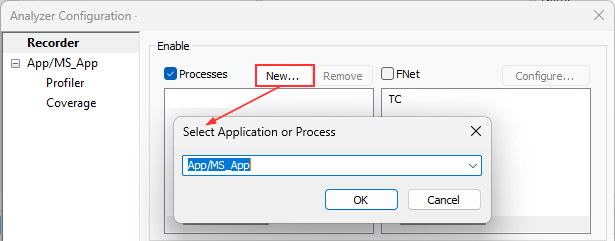
When you click on the newly created Process (e.g. App/MS_App), Profiler (and Coverage) pages will appear in the left menu.
|
(optional) Configure Recorder options. |

•Start - Trigger Immediately
•(optional) Enabled Upload while sampling to stream trace messages via the DAP interface
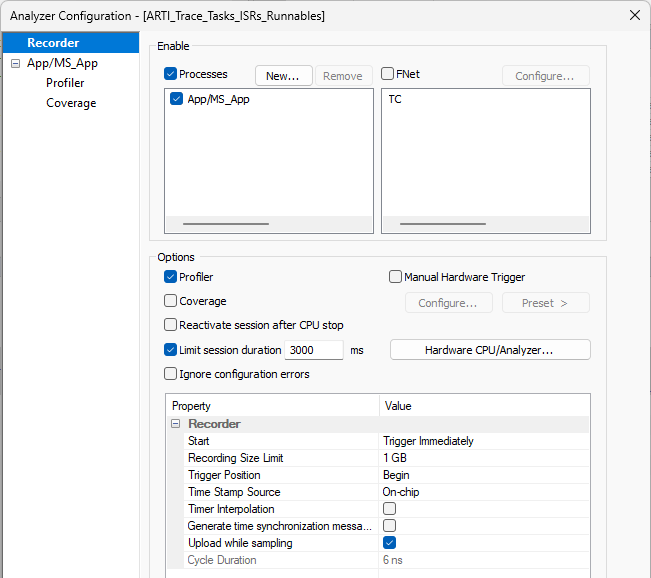
|
Make sure Manual Hardware Trigger is not checked. |

|
Enable Data and add new Profiler Data Area in the Profiler page. |

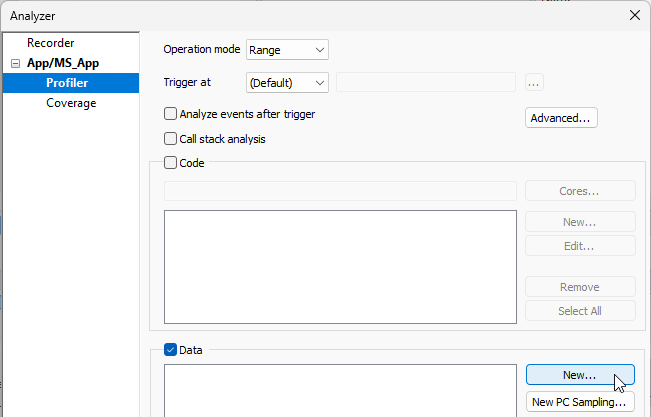
|
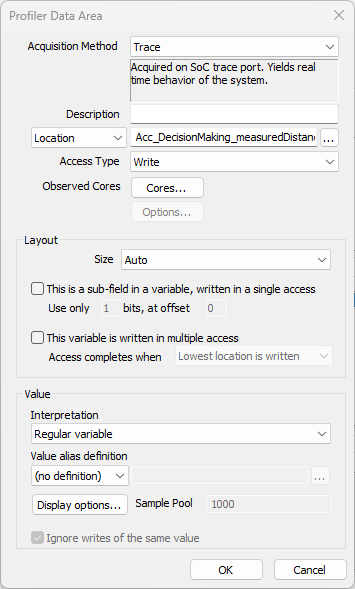
Configure Profiler Data Area. |


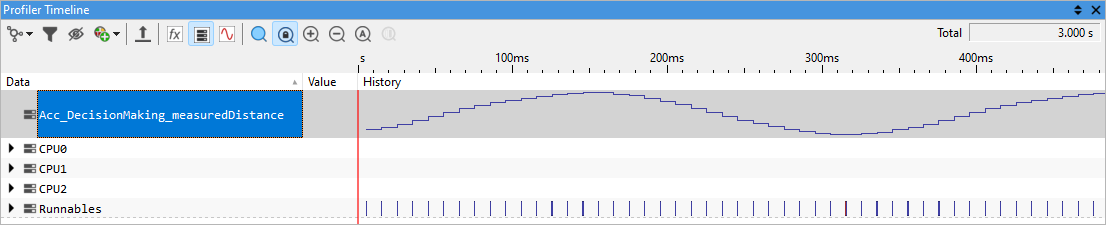
Results
More resources