GDB Client
In case hardware debug connection is not possible on your target, winIDEA can also work as a GDB Client.
iSYSTEM GDB Client allows:
- GDB Options configuration
- Watchpoints selection
- Use of the Attach feature
Using GDB Client
You can select the plugin after creating a new project (workspace) and selecting iSYSTEM GDB Client from the drop-down menu
Prerequisites
On a target, which is running a distribution of GNU/Linux, GDB Server must be installed and configured in order for GDB debugging to work from winIDEA.
Target must be connected to the network and must be reachable over the network from the PC running winIDEA.
|
Application executable needs to be on target's file system and should be executable. |

CPU description
Some of winIDEA's advanced features need to be aware of the CPU architecture. Open Debug / Configure session / SoCs tab.
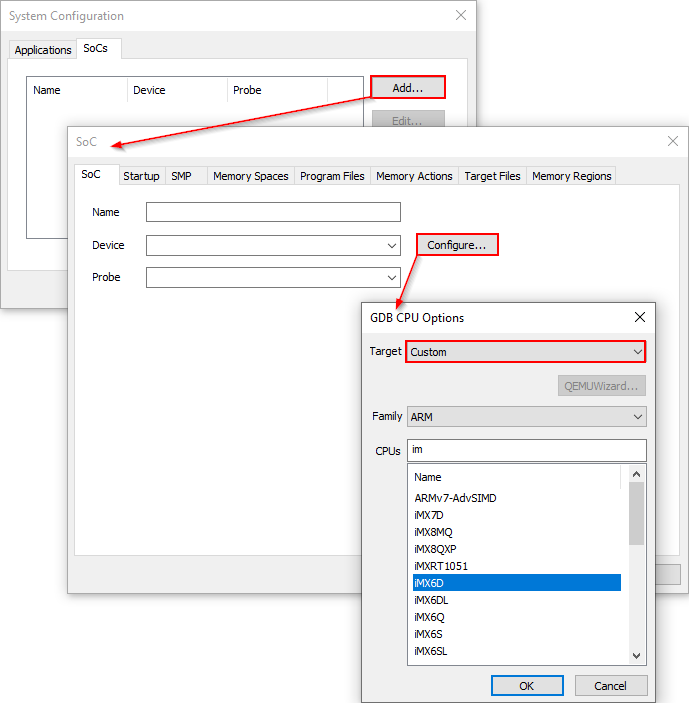 Select Custom CPU1. Click Add button in the System Configuration dialog. 2. Click Configure button in the SoC dialog. 3. Select Custom from the drop-down menu. 4. Select CPU Family from the drop-down menu. 5. Select CPU from the list and confirm. |
GDB Configuration
Target IP
Open GDB menu / Options dialog to configure GDB Client.
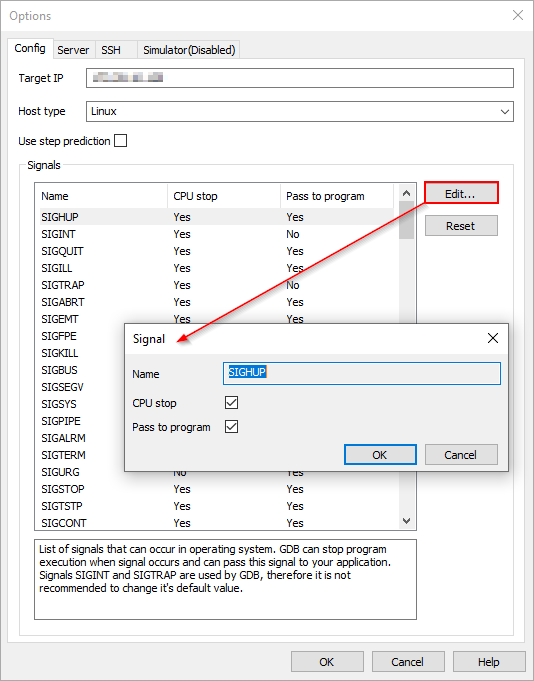 Target IP - Configure the Target IP to match the target where the application is executed. Host type - Select the host:
Use step prediction - This option should be used when GDB Server doesn’t support code stepping. With this option enabled winIDEA takes care of code stepping. Signals - Signals that can occur in the operating system. Edit - Open the Signal dialog and configure following setting:
|
|
It is not recommended to change signals SIGINT and SIGTRAP default value, because they are used by the GDB. |
GDB Server description
In order to connect to the GDB server, winIDEA needs additional information. Open GDB menu / Options / Server tab to provide the details:
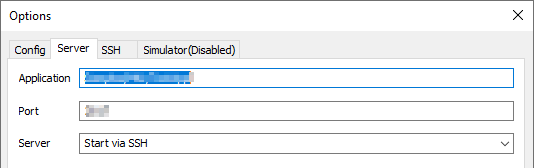 Application - Path to application executable on targets file system. This option is relevant only when GDB server is started from winIDEA. Port - Port number where GDB server is running on target. If you are using winIDEA to start the GDB server, this will be the port that will be used. Server:
|
Display the output in the Terminal Window
If SSH option is enabled, the output is displayed in the Terminal Window:
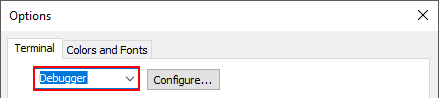 1. Open View menu / Workspace / Terminal 2. Click Options button in the Terminal Window toolbar 3. Select Debugger option from the drop-down menu in the Terminal tab |
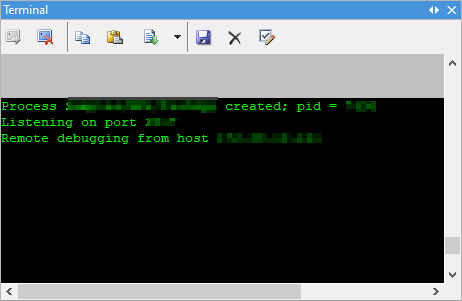 Terminal Window display |
SSH Connection parameters
The SSH protocol (Secure Shell) is a method for secure remote login from one computer to another. It provides several alternative options for strong authentication and communication protection.
SSH connection is used to start GDB Server on the target from winIDEA remotely. Open GDB / Options / SSH tab to provide the connection details:
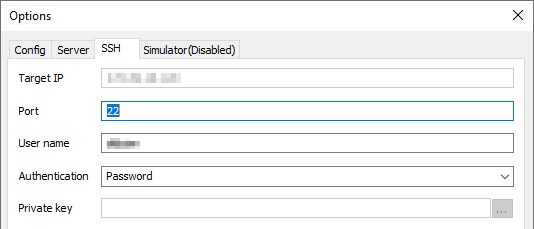 Port - Port number where SSH server is running on target (usually port 22). User name - User that winIDEA will use to log in to target over SSH and start GDB Server. Selected user should have rights to start GDB Server and execute application on target. Authentication - Method used for user authentication when winIDEA tries to login to target over SSH.
Private key path - This option is relevant when using private key for authentication. Set this to path to private key file used for authentication. |
Providing Application path
This step provides winIDEA the necessary information for source level debugging and provides the path to the debug symbols.
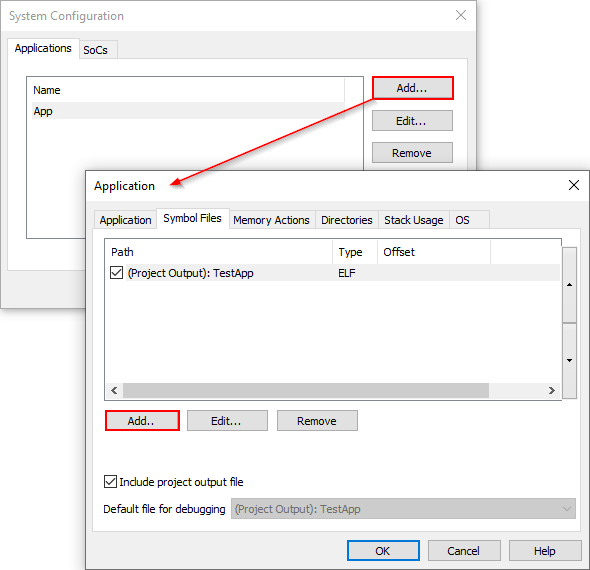 In order to get the necessary debug info, you will need to specify the download file (.elf in the example above): 1. Open Debug menu / Configure Session / Application tab. 2. Click Add button to open Application dialog. 3. In Symbol Files tab click Add to specify the download file. |
|
Note the executable will not be loaded to the target - it is only used to provide symbol information to winIDEA. |
Watchpoints
Open GDB menu / Watchpoints. Watchpoints are greyed out in the drop-down menu if Debug session is not established and if watchpoints are not supported for specific CPU architecture.
Dialog Watchpoints displays a list of configured watchpoints. First column allows enabling/disabling of a configured watchpoint.
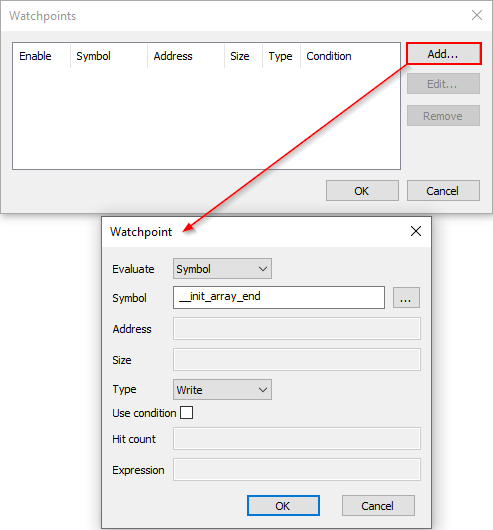 Add - Click the button to add watchpoints from the Watchpoint configuration dialog: Evaluate - Select watchpoint type:
Type - Select access type: Any, Read, Write. Use condition - If checked configuration of Hit count and Expression is enabled. |
Debugging with GDB Client
You should now be ready to debug your application with GDB. Perform a download to load the symbols in winIDEA and start the debug session on the target.
If application doesn’t stop at the application entry point after a reset or download, follow these steps:
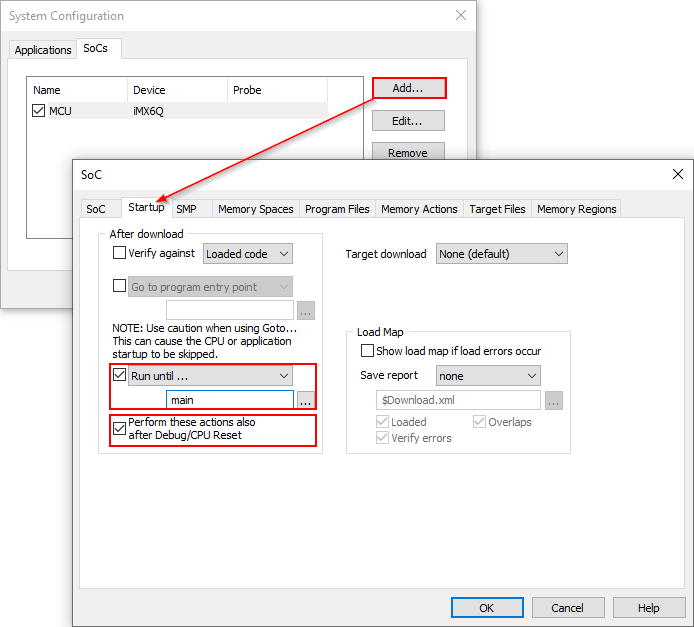 1. Open Debug / Configure Session / SoCs tab and click Add button. 2. In Startup tab enable Run until option and select the application entry point function by clicking ''...'' button. 3. Enable Perform these actions also after Debug/CPU Reset option. |