Breakpoints
In this topic:
winIDEA offers a variety of breakpoints to suit various debugging needs.
•Execution breakpoints - Used to stop code execution at the breakpoint before the code on that line is executed. Open Debug / Breakpoints for Execution Breakpoints dialog.
•Conditional breakpoints - Specifies the number of times the breakpoint is passed or/and the C expression evaluation matches until it activates. This breakpoints do not operate in real-time. Set conditional breakpoints via Debug / Breakpoints / Condition.
•Access breakpoints - Stops code execution when a specific memory is accessed.
•Hardware breakpoints - Faster, limited number, CPU architecture-dependant. Hardware breakpoints can be provided with additional conditions for example when this breakpoint is reached, start trace operation. The options for further breakpoint configurations are highly dependent on the MCU’s debug hardware implementation. Manually configure Hardware Breakpoints via Debug / Hardware Breakpoints.
•Software breakpoints - Set a breakpoint instruction to stop the CPU, unlimited number.
|
A simple Wizard allows you to configure Hardware Breakpoint either as an execution or access breakpoint. |
For a quick overview and convenient manipulation of the breakpoints during debugging, take a look at the Breakpoints window. By default, winIDEA is using Hardware Breakpoints.
Execution Breakpoints
You can view and manipulate all the breakpoints in the Debug / Breakpoints, which you can also open by pressing the Breakpoints button  in the Debug Toolbar.
Execution Breakpoints dialog shows the list of specified execution breakpoints. Execution Breakpoints are used when you wish to break program execution when a specific part of the application is executed. Execution Breakpoint can be either:
•Hardware Breakpoint (default, using the available on-chip logic) or
•Software Breakpoint (when enabled for the specified core).
 |
Checked breakpoints - Enabled (will be applied as soon as the debug session is established).
Unchecked breakpoints - Ignored.
Folder button - Opens a new dialogue, in which you can create a new breakpoint by typing in the name of a function.
Remove button - Allows you to remove a single breakpoint that is selected on the right (indicated by the blue background, not the checkmark).
Show button - Button guides you to the line in the Editor window where the selected breakpoint can be found.
Remove/Reapply/Enable/Disable All - Use the available buttons to configure the breakpoints to your need.
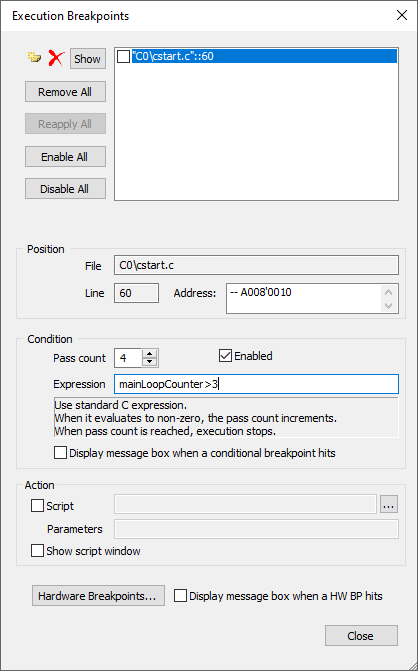
Shows where the breakpoint is set. If the breakpoint was set on the source level, it will show where exactly in the file it was set, and to which address the source line was resolved. If the breakpoint is set directly on a specific code address, it will show the address only. Pay attention to the designation written before the execution breakpoint address:
Address:
•HW - Hardware breakpoints was used. On-chip debug logic is used.
•SW - Software breakpoints was used. Object code was modified with an instruction that will stop the CPU when it's hit.
•--: - Breakpoint was not applied
Check the Enabled to convert the breakpoint to a conditional breakpoint.
Each time the breakpoint is passed the Expression (if present) will be evaluated and if it evaluates to true, it will count as one more pass. When the breakpoint is passed for as many times as specified in the pass count, breakpoint will be hit and the CPU will be stopped.
Pass count - How many times winIDEA should pass over the breakpoint before stopping.
Expression - Enter any C expression which evaluates true or false.
Display message box when a conditional breakpoint hits - winIDEA can display a message each time a conditional breakpoint is hit.
|
Keep in mind that the CPU actually stops each time a conditional breakpoint is passed in order to evaluate the condition and then resumes the CPU. |

When a breakpoint is hit a Python script may be executed. Enable this option and specify the Python script you wish to execute.
Manually configure the hardware breakpoints. The dialog reflects the On-Chip debug logic, therefore you should refer to the microcontroller reference manual provided by the silicon vendor to learn about the specifics and possibilities for your chosen microcontroller.
Display message box when a HW BP hits - A message displayed indicating that an hardware breakpoint has occurred.
Disabling and clearing/deleting breakpoints
winIDEA differentiate between disabled or cleared/deleted breakpoint:
Clear breakpoints |
Disable breakpoints |
Deleted |
Still visible, but do not execute |
Have to be set again |
Can be enabled again |
Can not be found again |
Can be used as a bookmark |
|
Disabling breakpoints leaves a visible mark in the glyph margin making it easy to re-enable the breakpoint again if required. |
Depending on the focused window, winIDEA will:
•Editor : Set a breakpoint on a source line, which will later be resolved to a matching object code address.
•Disassembly : Set a breakpoint on a specific object code address.
More resources
 Knowledge Base Breakpoints Breakpoints window