Start with Trace Wizard
In this topic:
•Trigger on a function and record code
•Trigger on a data and record data
•Trigger on a data and record code and data
Introduction
The winIDEA Trace Wizard simplifies the configuration of common trace scenarios with just a few clicks.
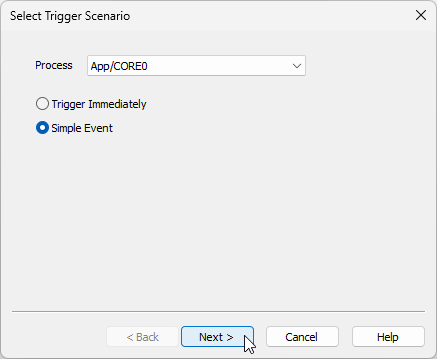
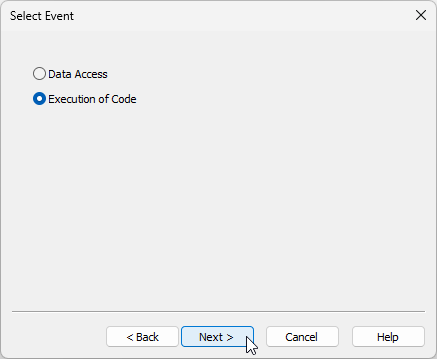
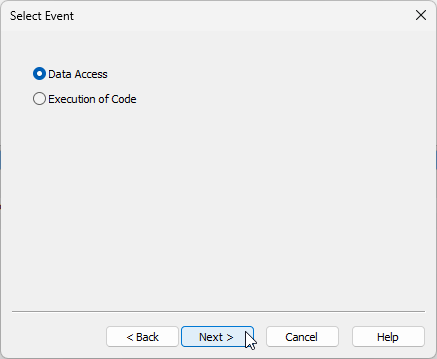
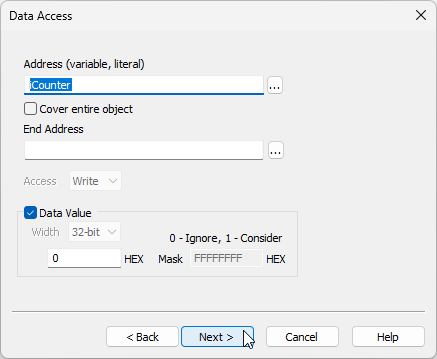
You begin by selecting a Process. Then, you can choose between two trigger scenarios: immediate trigger or triggering upon a specified event, such as data access or code execution. For data access triggers, you can specify the address, object coverage, end address, access type, and data value (width type, etc.).
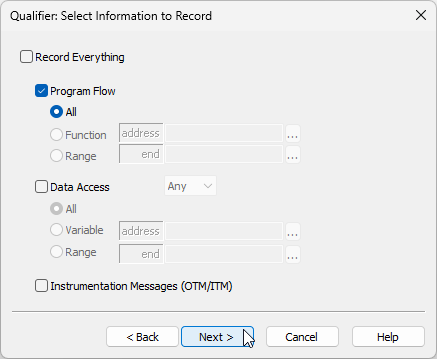
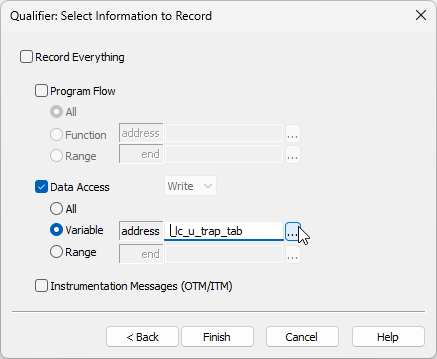
In the third step, you configure qualifiers and define the information to be recorded, such as comprehensive recording (all data), program flow (all, specific functions, or within a range), data access (all, specific variables, or within a range), and instrumentation messages (OTM/ITM).
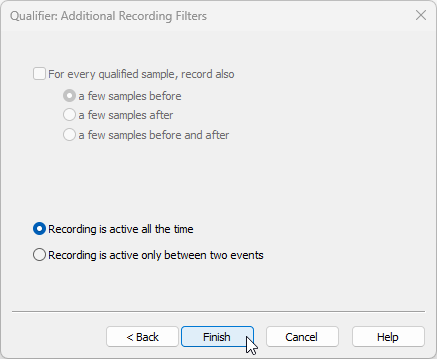
After that, you set additional recording filters that refine the recording criteria by specifying samples before and after each qualified event, continuous recording, or recording between two specific events.
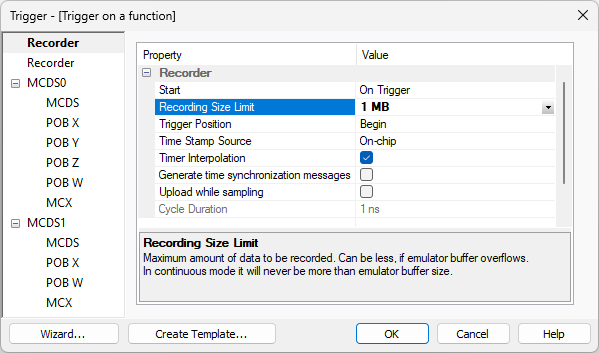
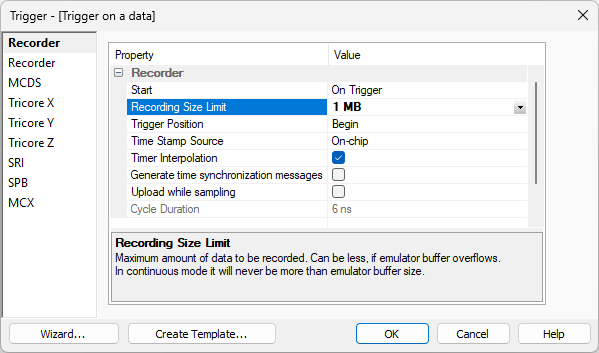
Upon completing these steps, you are directed to the Recorder Configuration where you can further configure the recording settings and any additional parameters, such as Recording Size Limit.
This tutorial guides you through three simple use cases.
Opening the Trace Wizard
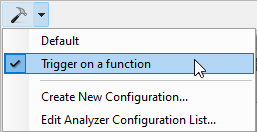
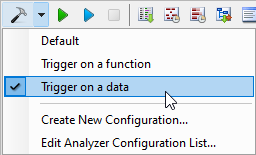
Go to View | Analyzer | Analyzer Configuration arrow | Create New Configuration, give it a meaningful name, and select Wizard.
Make sure Analyzer Operation mode is configured.

Trigger on a function and record code
Once the Wizard is opened, configure the following settings.
|
Select Simple Event for the Trigger Scenario. |
|---|

|
Select Execution of Code for the Event. |

|
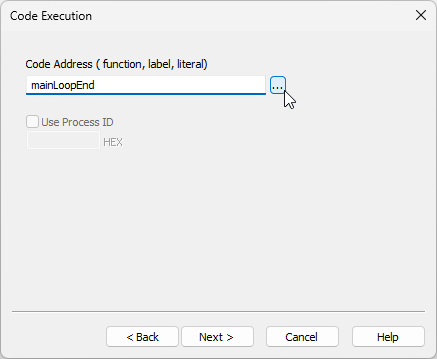
Select a function from the Symbol Browser | Functions tab for the Code Address. |

|
Make sure Program Flow | All is selected. |

|
Keep default Recording is active all the time selected for the Additional Recording Filter. |

|
Set Recording Size Limit. |

It is recommended to reduce the amount of data to be recorded (e.g.1 MB can be a good starting point) to your specific needs since this directly impacts trace upload time and trace window responsiveness. It makes no sense to record big amount of code around the trigger event if your interest is only a small part of the code in the trigger vicinity. The bigger the trace recording is, the longer will take the trace upload and processing the recorded information.
|
Make sure the correct Analyzer Configuration Trigger is selected in the drop-down menu. |

Trigger on a data and record data
Once the Wizard is opened, configure following settings.
|
Select Simple Event for the Trigger Scenario. |
|---|
ž
|
Select Data Access for the Event. |
|
Select a variable from the Symbol Browser | Variables tab for the variable Address. |
•Access: Select Write (if possible) since typically write accesses are relevant only. Omitting read data accesses saves trace port bandwidth for other important trace information. If trace should trigger on any write access to this variable, skip configuring specific data value.
•Data Value Width: For specific data value entry set (if possible) Width to 8, 16 or 32-bit based on the variable size (or object data).
•Data Value Value: Enter the Value in a hexadecimal format.
|
Select Data Access. |
Make sure Program Flow | All is deselected.
|
Select the variable from the Symbol Browser | Variables tab for the variable Address. |
|
Keep default Recording is active all the time selected for the Additional Recording Filter. |
|
Set Recording Size Limit. |
It is recommended to reduce the amount of data to be recorded (e.g.1 MB can be a good starting point) to your specific needs since this directly impacts trace upload time and trace window responsiveness. It makes no sense to record big amount of code around the trigger event if your interest is only a small part of the code in the trigger vicinity. The bigger the trace recording is, the longer will take the trace upload and processing the recorded information.
|
Make sure the correct Analyzer Configuration Trigger is selected in the drop-down menu. |

Trigger on a data and record code and data
|
Select Simple Event for the Trigger Scenario. |
|---|
|
Select Data Access for the Event. |
|
Select a variable from the Symbol Browser | Variables tab for the variable Address. |
•Access: Select Write (if possible) since typically write accesses are relevant only. Omitting read data accesses saves trace port bandwidth for other important trace information. If trace should trigger on any write access to this variable, skip configuring specific data value.
•Data Value Width: For specific data value entry set (if possible) Width to 8, 16 or 32-bit based on the variable size (or object data).
•Data Value Value: Enter the Value in a hexadecimal format.
|
Select Data Access. |
|
Select the variable from the Symbol Browser | Variables tab for the variable Address. |
Make sure Program Flow | All is selected as well in order to record code along the specific data access.
|
Keep default Recording is active all the time selected for the Additional Recording Filter. |
|
Set Recording Size Limit. |
It is recommended to reduce the amount of data to be recorded (e.g.1 MB can be a good starting point) to your specific needs since this directly impacts trace upload time and trace window responsiveness. It makes no sense to record big amount of code around the trigger event if your interest is only a small part of the code in the trigger vicinity. The bigger the trace recording is, the longer will take the trace upload and processing the recorded information.
|
Make sure the correct Analyzer Configuration Trigger is selected in the drop-down menu. |
Next steps